Ad

Showing posts with label coronal mass ejection. Show all posts

Friday, November 6, 2015

Solar Flare - Significant Delays In Sweden Airports

In keeping with the topic of interest, a recent solar flare caused significant delay in Sweden airports STORY FOUND HERE


The Sun stripped away the atmosphere of Mars' atmosphere, causing catastrophic climate change. This happened because of solar wind being spewed from eruptions from Sun spots, much like what happens when we have solar flare eruptions that face Earth. MORE ON THIS STORY HERE


The graphic above is located HERE

NASA revealed beautiful 4K footage of the Sun shown below.


Coronal holes are very common and so are solar flares.  However, many solar flares don't get directed straight towards Earth.  If a large X-Class flare erupts from a Sun spot (Coronal Hole), shooting a coronal mass ejection (CME) straight towards Earth, air traffic can be disrupted, electrical grids can be damaged and beautiful aurora lights can be seen.  MORE ON CORONAL HOLES HERE

CLICK HERE for more on space weather.

Saturday, June 1, 2013

Interplanetary Shock Wave From Unknown Source Causing Strong Geomagnetic Storm

GEOMAGNETIC STORM: A G2-class (Kp=6) geomagnetic storm is in progress following the arrival of an interplanetary shock wave on May 31st. The source of the shock is not known; it might have been a minor CME that left the sun without drawing attention to itself. The impact sparked auroras across many northern-tier US states. This photo, for instance, comes from Christopher Griffith in Baxter, Minnesota:

"I wasn't expecting to see any lights, but right before the midnight it broke loose and the sky lit up," says Griffith. "Sadly the clouds quickly filled in my little window, and the auroras were gone. Just thankful for what I got so see!" Elsewhere in the USA, auroras were sighted as far south as ColoradoMarylandIowaWisconsin, andNebraska.
High-latitude sky watchers should remain alert for auroras tonight as Earth's magnetic field continues to reverberate from the impact. NOAA forecasters estimate a 40% chance of polar geomagnetic storms on June 1st.


Space Weather Message Code: ALTK06
Serial Number: 308
Issue Time: 2013 Jun 01 1502 UTC
ALERT: Geomagnetic K-index of 6
Threshold Reached: 2013 Jun 01 1500 UTC
Synoptic Period: 1500-1800 UTC
Active Warning: Yes
NOAA Scale: G2 - Moderate
Potential Impacts: Area of impact primarily poleward of 55 degrees Geomagnetic Latitude.
Induced Currents - Power grid fluctuations can occur. High-latitude power systems may experience voltage alarms.
Spacecraft - Satellite orientation irregularities may occur; increased drag on low Earth-orbit satellites is possible.
Radio - HF (high frequency) radio propagation can fade at higher latitudes.
Aurora - Aurora may be seen as low as New York to Wisconsin to Washington state.

Thursday, May 23, 2013

Explosion On The Sun Exposes Earth To An Ongoing Radiation Storm


SUBSIDING RADIATION STORM: A solar radiation storm in progress around Earth is slowly subsiding. It currently ranks S2 (moderate) on NOAA storm scales, which means that satellites in Earth orbit could experience "single event upsets" in their electronic systems. The radiation storm is also a source of noise in spacecraft cameras, giving their images a snowy appearance (see below)
.
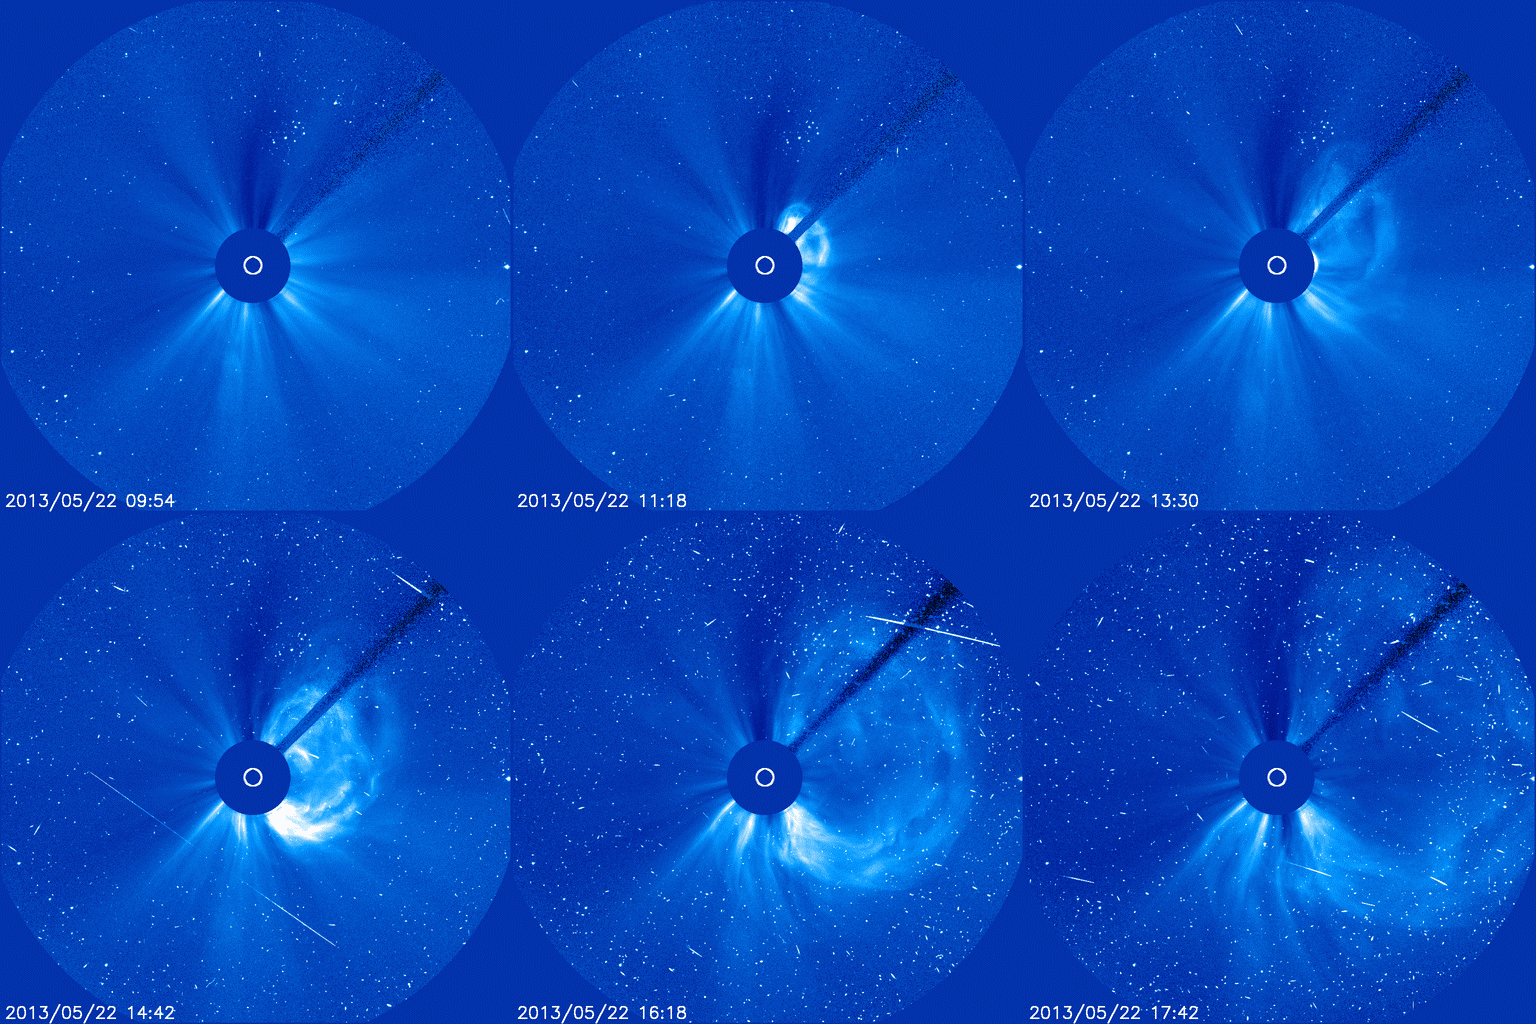
M5-CLASS EXPLOSION: The ongoing radiation storm got started on May 22nd when the magnetic canopy of sunspot AR1745 exploded. The blast produced an M5-class solar flare and hurled a magnificent CME over the sun's western limb:


Credit: the Solar and Heliospheric Observatory (SOHO)
The movie of the CME is very "snowy." That is caused by high-energy solar protons striking the CCD camera in SOHO's coronagraph. Each strike produces a brief snow-like speckle in the image. This hailstorm of solar protons is what forecasters mean by "radiation storm."

Although the explosion was not squarely Earth-directed, the CME will likely be geoeffective. The expanding cloud appears set to deliver a glancing blow to Earth's magnetic field on May 24th around 1200 UT. According to NOAA forecast models, the impact will more than double the solar wind plasma density around Earth and boost the solar wind speed to ~600 km/s. High-latitude sky watchers should be alert for auroras.


Solar storms threaten the US
23/05/2013 02:29 (16:38 minutes ago)
The FINANCIAL -- A large solar storm could leave tens of millions of people in North America without electrical power for several months, if not years, potentially costing trillions of dollars, according to Lloyd’s latest emerging risks report: Solar Storm Risk to the North American Electric Grid.

Large geomagnetic storms, while relatively rare, can create a massive surge of current, potentially overloading the electric grid system and damaging expensive, and critical, transformers, according to report.

A large solar storm in 1989 triggered the collapse of Quebec’s electrical power grid– leaving six million Canadians without power for nine hours – while a smaller storm in 2003 caused blackouts in Sweden as well as damage to transformers in South Africa (transformers at that latitude were previously thought to be immune from such damage).

However, much bigger and potentially more disruptive events are possible. The Carrington Event of 1859 is widely regarded as the most extreme space weather event on record. It is thought that such an event today would affect between 20-40 million people in the US with power cuts lasting from several weeks to 1-2 years. The economic costs would be catastrophic – estimated at between $0.6 and $2.6trn.
Carrington-level extreme geomagnetic storm is rare. Historical records suggest a return period of 50 years for Quebec-level storms, and 150 years for very extreme storms, such as the Carrington Event. However, far weaker storms still pose a significant risk.

Governments are waking up to the risk and taking the threat of geomagnetic storms seriously.

A severe geomagnetic storm event in North America could have significant implications for the insurance industry. Sustained power outages could expose insurers to significant business interruption claims, although exactly how cover for such an event would respond is uncertain.

Extreme solar weather is a huge potential threat for power companies and their insurers, according to John Chambers, deputy active underwriter at Aegis London, a specialist insurer of power companies.

"Insurers and risk managers have made some progress in identifying geographical areas and types of equipment that could be more susceptible to loss. However, the lack of recent claims has meant that the issue is lower down the agenda for insurers than perhaps it should be and has made it harder for risk managers to get the appropriate capex budgets for risk mitigation," he says.

“Specialist power insurers should be looking at wordings and the use of sub-limits and stand-alone coverage, although they are open to engaging with other bodies to look at ways of improving resilience and managing risk,” he adds.

“Geomagnetic storms present a huge potential risk with important implications for both insurers and society,” says Smith. “Insurers need to evaluate the potential impact of geomagnetic storms on the market, as well as work with governments and energy companies on ways to mitigate the risk at a society level,” he says.


NASA's SDO Observes Mid-level Solar Flare
05.22.13


UPDATE 16:30 p.m. EDT: The M7-class flare was also associated with a coronal mass ejection or CME, another solar phenomenon that can send billions of tons of particles into space. While this CME was not Earth-directed, it has combined with an earlier CME, and the flank of the combined cloud may pass Earth. Particles from the CME cannot travel through the atmosphere to harm humans on Earth, but they can affect electronic systems in satellites and on the ground.

This image, captured at 11:06 a.m. EDT on May 22, 2013, from the SOHO shows the conjunction of two coronal mass ejections streaming away from the sun.
› View larger
This image, captured at 11:06 a.m. EDT on May 22, 2013, from the ESA/NASA Solar and Heliospheric Observatory shows theconjunction of two coronal mass ejections streaming away from the sun. This image is what's known as a coronagraph, in which the light of the sun is blocked in order to make its dimmer atmosphere, the corona, visible. Credit:ESA and NASA/SOHO

Experimental NASA research models, based on observations from NASA’s Solar Terrestrial Relations Observatory and ESA/NASA’s Solar and Heliospheric Observatory show that the first CME began at 5:12 a.m. EDT, leaving the sun at about 400 miles per second. The second CME began at 9:24 a.m. EDT, leaving the sun at speeds of around 745 miles per second.

Earth-directed CMEs can cause a space weather phenomenon called a geomagnetic storm, which occurs when they funnel energy into Earth's magnetic envelope, the magnetosphere, for an extended period of time. In the past, geomagnetic storms caused by CMEs of this strength have usually been mild.

The NASA models also show that the combined CMEs will pass by the STEREO-A spacecraft and its mission operators have been notified. If warranted, operators can put spacecraft into safe mode to protect the instruments from the solar material.

NASA and NOAA – as well as the US Air Force Weather Agency (AFWA) and others -- keep a constant watch on the sun to monitor for space weather effects such as geomagnetic storms. With advance notification many satellites, spacecraft and technologies can be protected from the worst effects 

NOAA's Space Weather Prediction Center (http://swpc.noaa.gov) is the U.S. government's official source for space weather forecasts, alerts, watches and warnings.


NASA’s Solar Dynamics Observatory captured this image of a solar flare on the right side of the sun on May 22, 2013.
› View larger image
NASA’s Solar Dynamics Observatory captured this image of a solar flare on the right side of the sun on May 22, 2013. This image shows light in the 131 Angstrom wavelength, a wavelength that shows material heated to intense temperatures during a flare and that is typically colorized in teal. Credit: NASA/SDO

The sun emitted a mid-level solar flare on the morning of May 22, 2013. The flare peaked at 9:38 a.m. EDT and was classified as an M7. M-class flares are the weakest flares that can still cause some space weather effects near Earth. In the past, they have caused brief radio blackouts at the poles.

Solar flares are powerful bursts of radiation. Harmful radiation from a flare cannot pass through Earth's atmosphere to physically affect humans on the ground, however -- when intense enough -- they can disturb the atmosphere in the layer where GPS and communications signals travel. This disrupts the radio signals for as long as the flare is ongoing, anywhere from minutes to hours.

Increased numbers of flares are quite common at the moment, since the sun's normal 11-year activity cycle is ramping up toward solar maximum, which is expected in late 2013. Humans have tracked this solar cycle continuously since it was discovered in 1843, and it is normal for there to be many flares a day during the sun's peak activity.

NOAA's Space Weather Prediction Center (http://swpc.noaa.gov) is the U.S. government's official source for space weather forecasts, alerts, watches and warnings. Updates will be provided as they are available on the flare and whether there was an associated coronal mass ejection or CME, another solar phenomenon that can send solar particles into space and affect electronic systems in satellites and on Earth. 
Animated GIF showing M7 class solar flare occurring on May 22, 2013 as viewed by SDO.
› Download animated gif
These images of a solar flare were captured by NASA’s Solar Dynamics Observatory on May 22, 2013. This image shows light in the 131 Angstrom wavelength, a wavelength that shows material heated to intense temperatures during a flare and that is typically colorized in teal. Credit: NASA/SDO/GSFC


Geomagnetic storm

geomagnetic storm is a temporary disturbance of the Earth's magnetosphere caused by a solar wind shock wave and/or cloud of magnetic field which interacts with theEarth's magnetic field. The increase in the solar wind pressure initially compresses the magnetosphere and the solar wind's magnetic field interacts with the Earth’s magnetic field and transfers an increased energy into the magnetosphere. Both interactions cause an increase in movement of plasma through the magnetosphere (driven by increased electric fields inside the magnetosphere) and an increase in electric current in the magnetosphere and ionosphere.
During the main phase of a geomagnetic storm, electric current in the magnetosphere creates a magnetic force which pushes out the boundary between the magnetosphere and the solar wind. The disturbance in the interplanetary medium which drives the geomagnetic storm may be due to a solar coronal mass ejection (CME) or a high speed stream (co-rotating interaction region or CIR)[1] of the solar wind originating from a region of weak magnetic field on the Sun’s surface. The frequency of geomagnetic storms increases and decreases with the sunspot cycle. CME driven storms are more common during the maximum of the solar cycle and CIR driven storms are more common during the minimum of the solar cycle.
There are several space weather phenomena which tend to be associated with or are caused by a geomagnetic storm. These include: Solar Energetic Particle (SEP) events, geomagnetically induced currents (GIC), ionospheric disturbances which cause radio and radar scintillation, disruption of navigation by magnetic compass and auroral displays at much lower latitudes than normal. In 1989, a geomagnetic storm energized ground induced currents which disrupted electric power distribution throughout most of the province of Quebec[2] and caused aurorae as far south as Texas.[3]
Artist's depiction of solar wind particles interacting with Earth's magnetosphere. Sizes are not to scale.


Sunday, May 19, 2013

Solar Flare Propels Coronal Mass Ejection Towards Earth and Likely Will Cause Geomagnetic Storms Starting Today, May 19, 2013

CME IMPACT: A CME hit Earth's magnetic field on May 19th at 2250 UT (3:50 PM PDT). Polar geomagnetic storms and high-latitude auroras are possible in the hours ahead. Stay tuned for updates. 

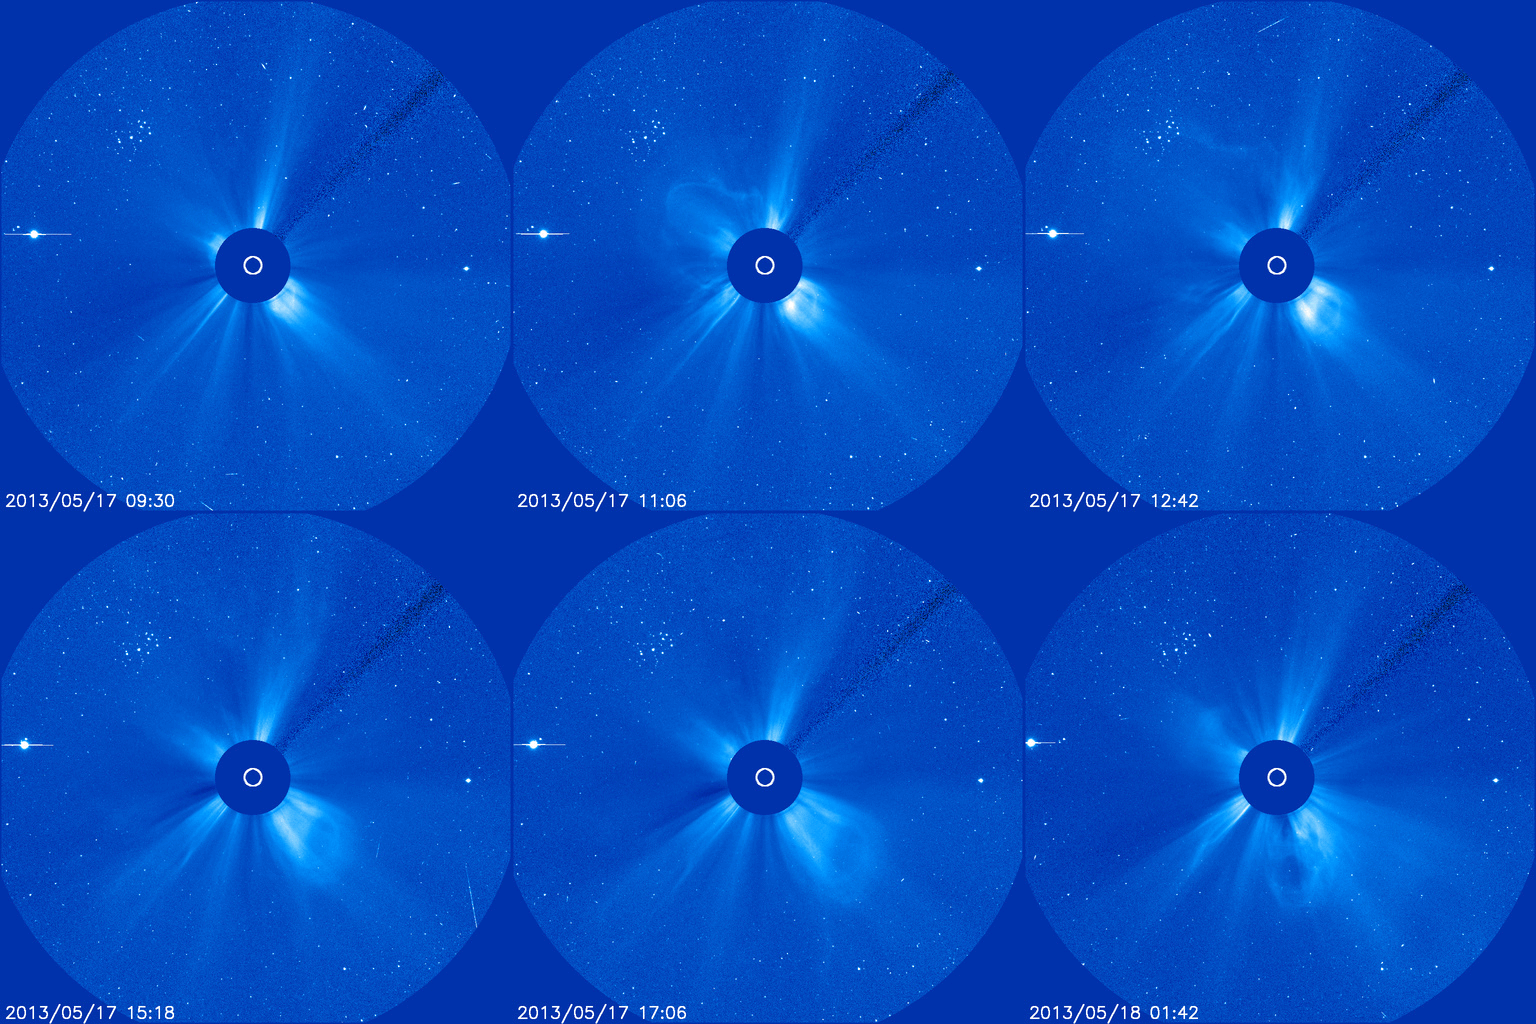
The CME was propelled toward Earth on May 17th by an M3-class solar flare in the magnetic canopy of sunspot AR1748. SOHO took this picture of the CME racing away from the sun at 1500 km/s (3.4 million mph):


It was hurled into space by an M3-class solar flare in the magnetic canopy of sunspot AR1748. In the video, the CME appears to hit Mercury, but it does not. It is merely passing in front of the innermost planet. The planet in the line of fire is Earth.

AURORAS INVADE THE USA: A CME hit Earth's magnetic field on May 18th at around 0100 UT. Although it was just a glancing blow, the impact was enough to spark a G1-class geomagnetic storm. In the United States, Northern Lights descended as far south as Pawnee Buttes, Colorado:


"The aurora was not visible to the naked eye," says photographer Robert Arn. "Only with a 30 second exposure did I know it was there. As I started to collect data, I noticed an electrical storm in the distance. The juxtaposition of the electrical storm and aurora made for a spectacular image. (The moon near the horizon illuminated the landscape.)"

Elsewhere in the United States, faint auroras were photographed in Michigan, Massachusetts, Washington, Vermont, and Iowa. Browse the aurora gallery for more sightings.


Planetary K-index
Now: Kp= 2 quiet
24-hr max: Kp= 4 
unsettled
explanation | more data
Interplanetary Mag. Field
Btotal13.8 nT
Bz3.3 nT south 
explanation | more data
Updated: Today at 2357 UT

SWPC ACE RTSW MAG 24-hour Updating Plot

3-day Estimated Planetary K-index graph


The K-index

The K-index is a code that is related to the maximum fluctuations of horizontal components observed on a magnetometer relative to a quiet day, during a three-hour interval. The conversion table from maximum fluctuation (nT) to K-index, varies from observatory to observatory in such a way that the historical rate of occurrence of certain levels of K are about the same at all observatories. In practice this means that observatories at higher geomagnetic latitude require higher levels of fluctuation for a given K-index. The conversion table for the Boulder magnetometer is shown below:
K
nT
0
0-5
1
5-10
2
10-20
3
20-40
4
40-70
5
70-120
6
120-200
7
200-330
8
330-500
9
>500
At SWPC, we monitor the preliminary values of the K-index, minute by minute, from a network of observatories that relay data in near-real time. The final K-indices are determined after the end of prescribed three hourly intervals (0000-0300, 0300-0600, ..., 2100-2400). The maximum positive and negative deviations during the 3-hour period are added together to determine the total maximum fluctuation. These maximum deviations may occur anytime during the 3-hour period.


Relationship between Kp and the Aurora [ref]
Right: From thousands of observations, Cornell University scientists have determined geographic subpoints for the southern edges of auroral displays. The curves represent four values of the planetary index (Kp). As this index increases, the aurora's southern edge moves southward

In this article we briefly explain some of the ideas behind the association of the aurora with geomagnetic activity and a bit about how the ‘K-index’ or ‘K-factor’ works. The aurora is understood to be caused by the interaction of high energy particles (usually electrons) with neutral atoms in the earth's upper atmosphere. These high energy particles can ‘excite’ (by collisions) valence electrons that are bound to the neutral atom. The ‘excited’ electron can then ‘de-excite’ and return back to its initial, lower energy state, but in the process it releases a photon (a light particle). The combined effect of many photons being released from many atoms results in the aurora display that you see.

The details of how high energy particles are generated during geomagnetic storms constitute an entire discipline of space science in its own right. The basic idea, however, is that the Earth’s magnetic field (let us say the ‘geomagnetic field’) is responding to a outwardly propagating disturbance from the Sun. As the geomagnetic field adjusts to this disturbance, various components of the Earth’s field change form, releasing magnetic energy and thereby accelerating charged particles to high energies. These particles, being charged, are forced to stream along the geomagnetic field lines. Some end up in the upper part of the earth’s neutral atmosphere and the auroral mechanism begins.

The disturbance of the geomagnetic field may also be measured by an instrument called a magnetometer. At our operations center we receive magnetometer data from dozens of observatories in one minute intervals. The data is received at or near to ‘real-time’ and allows us to keep track of the current state of the geomagnetic conditions. In order to reduce the amount of data that our customers have to deal with we convert the magnetometer data into three-hourly indices which give a quantitative, but less detailed measure of the level of geomagnetic activity. The K-index scale has a range from 0 to 9 and is directly related to the maximum amount of fluctuation (relative to a quiet day) in the geomagnetic field over a three-hour interval.

The K-index is therefore updated every three hours and the information is made available to our customers as soon as possible. The K-index is also necessarily tied to a specific geomagnetic observatory. For locations where there are no observatories, one can only estimate what the local K-index would be by looking at data from the nearest observatory, but this would be subject to some errors from time to time because geomagnetic activity is not always spatially homogenous. Another item of interest is that the location of the aurora usually changes geomagnetic latitude as the intensity of the geomagnetic storm changes. The location of the aurora often takes on an ‘oval-like’ shape and is appropriately called the auroral oval. A useful map of the approximate location of the auroral oval as a function of the Kp-index was published in the June 1968 copy Sky & Telescope (see page 348). The Kp index is derived through by an algorithm that essentially averages the K-indices from several stations. Note that as a storm becomes more intense, the edge of the auroral boundary typically moves to lower latitudes.

For further reading we can recommend a couple of books for you. An old, but classic text is The Polar Aurora, Oxford University Press, 1955, by Störmer. A more modern text is The Physics of Space Plasmas, 1991, by George Parks. If you are interested in real-time reporting of geomagnetic activity please make use of our 24-hour/day, 7 day/week services. We have an internet home page address (/), and a recorded message which is updated every three hours or as major activity occurs (303-497-3235). You can also reach us at 303-497-3204. We hope that you find this information helpful. If you have some further questions please don’t hesitate to let us know. Best wishes ! Chris Balch (cbalch@sec.noaa.gov)


SPACE WEATHER
NOAA Forecasts
Updated at: 2013 May 19 2200 UTC
FLARE
0-24 hr
24-48 hr
CLASS M
65 %
65 %
CLASS X
25 %
25 %
source: source: http://spaceweather.com/


3-day GOES X-ray Plot
The GOES X-ray Flux plot contains 5 minute averages of solar X-ray output in the 1-8 Angstrom (0.1-0.8 nm) and 0.5-4.0 Angstrom (0.05-0.4 nm) passbands. Data from the SWPC Primary and Secondary GOES X-ray satellites are shown. Some data dropouts from the Primary satellite will occur during satellite eclipses.
source: http://www.swpc.noaa.gov/rt_plots/xray_5m.html

SWPC ACE RTSW MAG & SWEPAM 24-hour Updating Plot

source: http://www.swpc.noaa.gov/ace/MAG_SWEPAM_24h.html


Geomagnetic Storms:
Probabilities for significant disturbances in Earth's magnetic field are given for three activity levels:activeminor stormsevere storm

Updated at: 2013 May 19 2200 UTC
Mid-latitudes
0-24 hr
24-48 hr
ACTIVE
35 %
15 %
MINOR
30 %
05 %
SEVERE
20 %
01 %
High latitudes
0-24 hr
24-48 hr
ACTIVE
05 %
15 %
MINOR
20 %
25 %
SEVERE
75 %
25 %


ACTIVE:

Geomagnetic Storm Forecasts
The geomagnetic storm probabilities are the estimated chances of at least one 3-hour K index, at the indicated level, for each of the next 3 days.

Active: K = 4.
Minor storm: K = 5.
Major or Severe storm: K > 6.

The "K index" is a 3-hourly quasi-logarithmic local index of geomagnetic activity relative to an assumed quiet-day curve for the recording site. Range is from 0 to 9. The K index measures the deviation of the most disturbed horizontal component of the magnetic field.
http://spaceweather.com/glossary/geostorm.html

MINOR:

Geomagnetic Storm Forecasts
The geomagnetic storm probabilities are the estimated chances of at least one 3-hour K index, at the indicated level, for each of the next 3 days.

Active: K = 4.
Minor storm: K = 5.
Major or Severe storm: K > 6.

The "K index" is a 3-hourly quasi-logarithmic local index of geomagnetic activity relative to an assumed quiet-day curve for the recording site. Range is from 0 to 9. The K index measures the deviation of the most disturbed horizontal component of the magnetic field.


http://spaceweather.com/glossary/geostorm.html

SEVERE:
Geomagnetic Storm Forecasts
The geomagnetic storm probabilities are the estimated chances of at least one 3-hour K index, at the indicated level, for each of the next 3 days.

Active: K = 4.
Minor storm: K = 5.
Major or Severe storm: K > 6.

The "K index" is a 3-hourly quasi-logarithmic local index of geomagnetic activity relative to an assumed quiet-day curve for the recording site. Range is from 0 to 9. The K index measures the deviation of the most disturbed horizontal component of the magnetic field.

http://spaceweather.com/glossary/geostorm.html


Wednesday, May 15, 2013

ANOTHER X-CLASS SOLAR FLARE...Solar Alert! Heading to a Bastille Day Event?


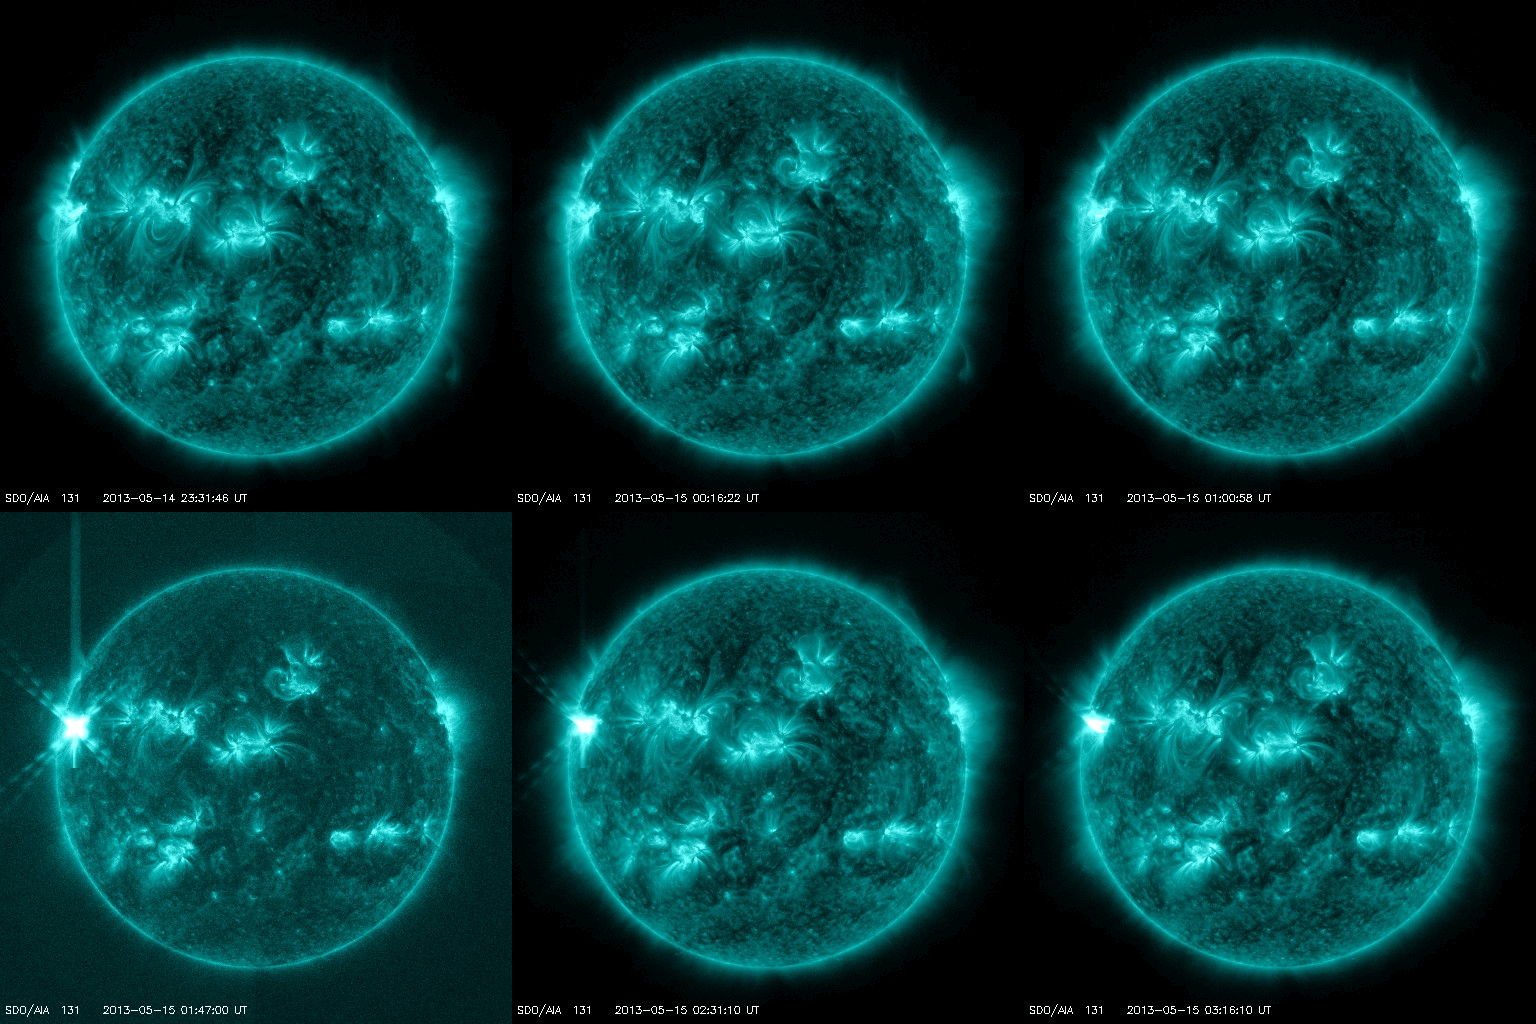
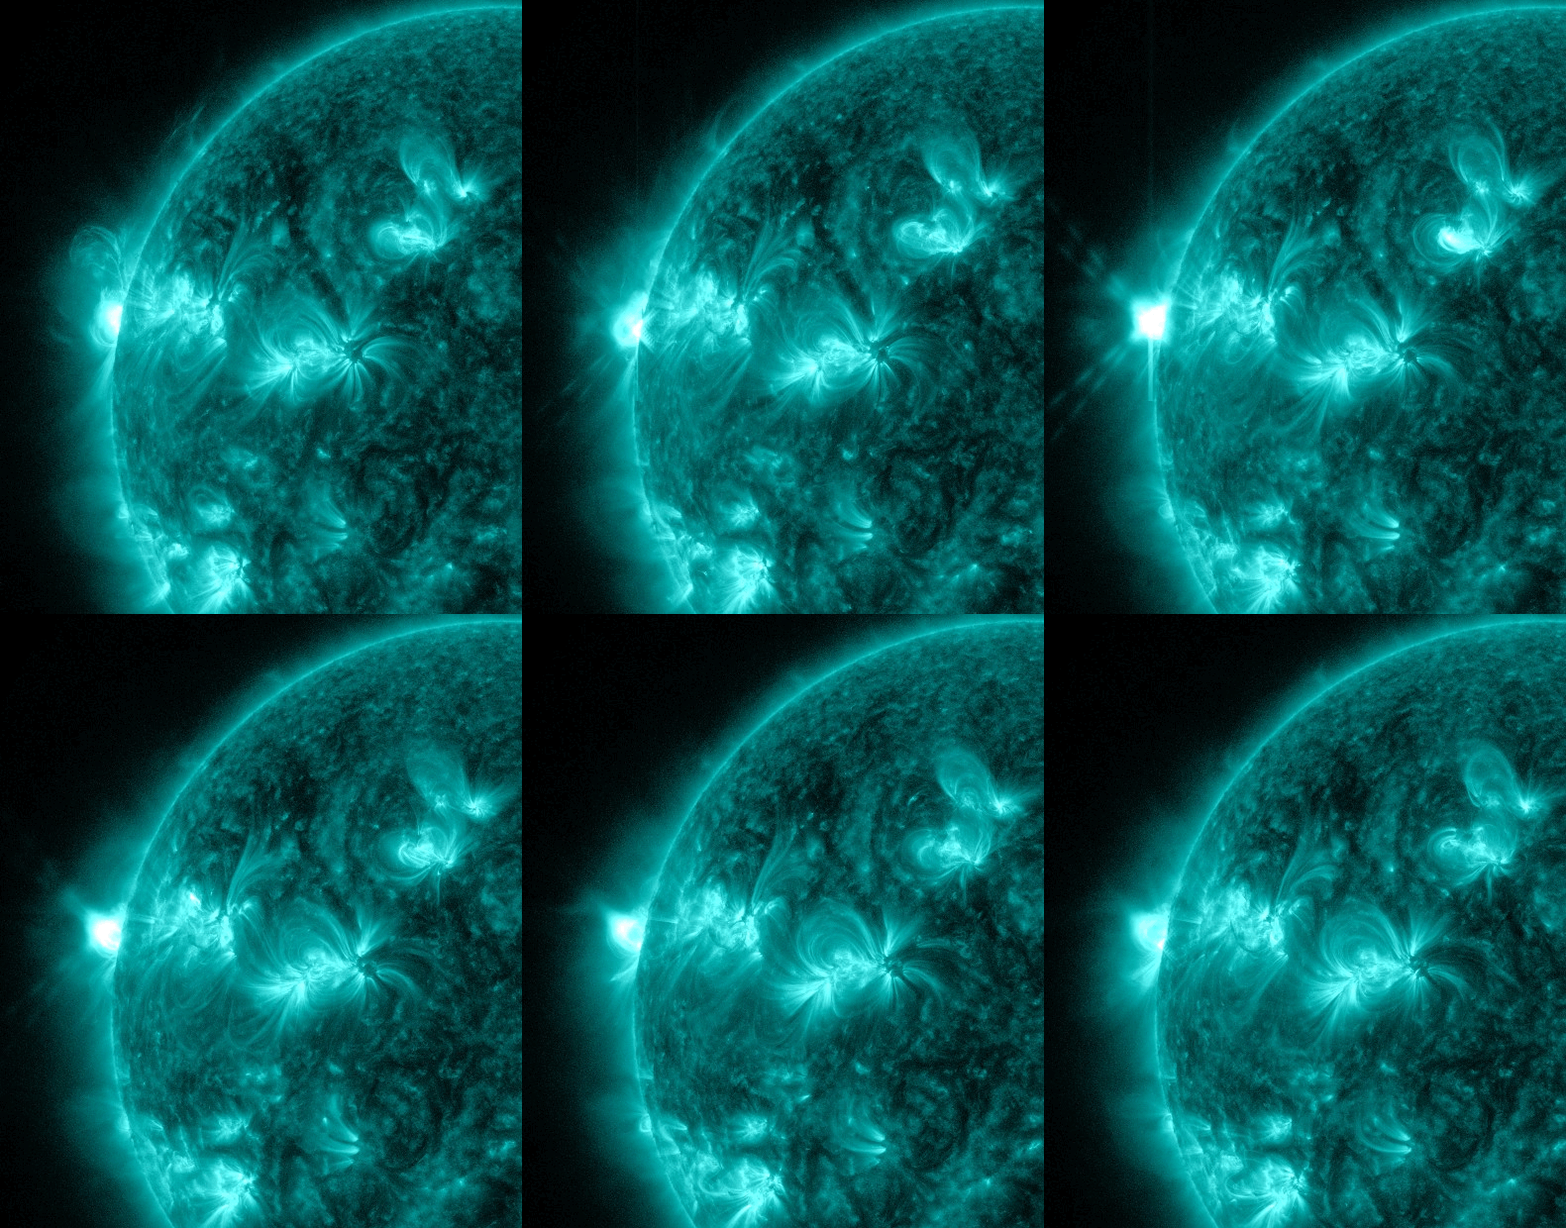
ANOTHER X-FLARE ON MAY 15: When the week began, the sun hadn't unleashed an X-flare all year long. In only two days, sunspot AR1748 has produced four. The latest X-flare from this active sunspot occured on May 15th at 0152 UT. NASA's Solar Dynamics Observatory captured the extreme ultraviolet flash:
Although the sunspot is not directly facing Earth, this flare might have produced a CME with an Earth-directed component. We are waiting for coronagraph data from SOHO and the twin STEREO probes to check this possibility. Stay tuned for updates.

In summary, AR1748 has produced an X1.7-class flare (0217 UT on May 13), anX2.8-class flare (1609 UT on May 13), an X3.2-class flare (0117 UT on May 14), and an X1-class flare (0152 on May 15). These are the strongest flares of the year, and they signal a significant increase in solar activity
SPACE WEATHERNOAA Forecasts
Updated at: 2013 May 14 2200 UTC
FLARE
0-24 hr
24-48 hr
CLASS M
80 %
80 %
CLASS X
50 %
50 %


.....................................end update..........................................................
UPDATE 3-14-2013

IF ANY OF YOU SAW AN X20+ FLARE TO THE LEFT ON THE SIDEBAR AT SPACEWEATHER.COM AND STARTED TO PANIC...
(UNDER "CURRENT CONDITIONS")
...CACHED COPY...

X-ray Solar Flares
6-hr max: X20+ 
5 UT May14 
24-hr: X20+ 
UT May14 
explanation | more dataUpdated: Today at: UT


...THIS HAS BEEN CORRECTED, THANK GOODNESS.  A PANIC HAPPENED REGARDING THIS IN 2011 AS WELL.  Not to worry.  It has been corrected.  However, let us remember when a huge X-class flare hit the Earth in 1989.


Now we have this from SpaceWeather.com

Solar wind
speed: -9999.9 km/sec
density: 2.3 protons/cm3
explanation | more dataUpdated: Today at 1614 UT

Something is definitely up to something on their site!!!!


Here are the flares for today...

Solar flares today

Today, 2 solar flares were observed: 

Active regionBegin, UTMax, UTEnd, UT
Flare of class X3.2174800:00:0001:11:0001:20:00
Flare of class C1.8174812:18:0012:22:0012:24:00

Solar flares yesterday

Yesterday, 14 solar flares were observed: 

Active regionBegin, UTMax, UTEnd, UT
Flare of class C9.3174800:32:0000:39:0000:46:00
Flare of class X1.7174801:53:0002:17:0002:32:00
Flare of class C2.4007:02:0007:06:0007:09:00
Flare of class C2.0008:02:0008:07:0008:11:00
Flare of class C4.5174508:35:0008:38:0008:44:00
Flare of class C2.8174809:24:0009:29:0009:37:00
Flare of class C1.7010:34:0010:37:0010:40:00
Flare of class M1.3174811:57:0012:03:0012:09:00
Flare of class C4.0174812:47:0012:52:0013:00:00
Flare of class C5.3174813:55:0014:40:0015:10:00
Flare of class X2.8174815:48:0016:05:0016:16:00
Flare of class C2.9174821:26:0021:29:0021:34:00
Flare of class C8.3174521:58:0022:05:0022:11:00
Flare of class X3.2174800:00:0001:11:0001:20:00

source: http://www.tesis.lebedev.ru/en/sun_flares.html


Monday was the Sun’s angriest day in years

  • third-x-class-solar-flare
    This image shows an X3.2 solar flare (far left) erupting from the sun late Monday (May 13, 2013) as seen by NASA's Solar Dynamics Observatory. It was the third major X-class solar flare in 24 hours. (NASA/SDO)


The sun, it seems, is in overdrive. Late Monday night, the sun unleashed its third major solar flare in 24 hours — the biggest and most powerful solar storm of the year, so far.

This latest sun storm erupted Monday (May 13) at 9:11 p.m. EDT (0111 GMT) and registered as an X3.2 solar flare, one of the strongest types of flares the sun can release, space weather officials said. It came on the heels of two other recent X-class solar flares on Sunday night and Monday, all of which were sparked by a highly active sunspot on the sun's far left side.

'Clearly an extraordinary active region is making its way fully onto the visible disk.'
- NOAA Space Weather Prediction Center officials

Officials at the NOAA Space Weather Prediction Center in Boulder, Colo., appeared amazed at the intense activity from the crackling sunspot. 

"Clearly an extraordinary active region is making its way fully onto the visible disk," SWPC officials wrote in a morning update today (May 14). "Can it keep up this hectic pace?"

Two of the three recent solar flares have been associated with massive explosions, called coronal mass ejections, which flung super-hot solar material into space at millions of miles per hour. Because the sunspot firing off the flares is not yet facing Earth, the solar eruptions pose no threat to satellites and astronauts in orbit, NASA has said.

"This marks the 3rd X-class flare in 24 hours," officials with NASA's sun-watching Solar Dynamics Observatory wrote in a statement. "Just like the two before this one also happened over the eastern limb of the sun and is not Earth-directed."

According to astronomer Tony Phillips of Spaceweather.com, scientists have just given the active sunspot a name: AR1748. It is one of nine active numbered sunspots currently visible on the surface of the sun.

While AR1784 has been spouting off many solar flares in recent days, most of them more moderate, M-class solar flares, the events on Sunday and Monday are taking solar activity to another level.

"These are the strongest flares of the year so far, and they signal a significant increase in solar activity," Phillips wrote in a Spaceweather.com update this morning.

Scientists use a tiered space weather scale to classify solar flare events, with each level representing a tenfold increase in power over the one before. At the bottom of the scale are A and B type solar flares, which have no effect on Earth. Next are C-class solar flares and the stronger, yet still medium-strength, M-class solar flares, which can supercharge Earth's auroras and cause radio blackouts when aimed at Earth.

X-class solar flares are the most powerful types of solar storms. When aimed directly at Earth, these major solar events can pose a danger to astronauts and satellites in space, as well as interfere with radio and GPS navigation signals.

The X3.2 solar flare is the most powerful yet seen this year and the third-strongest sun storm of the current 11-year solar cycle, called Solar Cycle 24. The second strongest was an X5.4 solar flare in 2012, while the largest event was an X6.9 flare in 2011. So far, there have been 18 X-class solar flares in Solar Cycle 24.

The first X-class solar flare of 2013 (the Sunday event) registered as an X1.7 on the flare scale, with the mid-day Monday flare rating as an X2.8, NASA officials said.

Solar activity on the sun rises and falls over the course of its 11-year cycle. The sun is active phase of Solar Cycle 24 as it approaches its peak activity period, called solar maximum, which is expected to occur later this year.

Scientists have been monitoring solar flares and other space weather events since their discovery in 1843. Today, NASA and other space agencies continuously monitor the sun with spacecraft like the Solar Dynamics Observatory to track potentially dangerous space weather events.


Read more: http://www.foxnews.com/science/2013/05/14/hyperactive-sun-fires-off-3-major-solar-flares-in-1-day/#ixzz2TIHiLuNU


SOURCE: http://www.swpc.noaa.gov/rt_plots/Xray.gif

The GOES X-ray Flux plot contains 5 minute averages of solar X-ray output in the 1-8 Angstrom (0.1-0.8 nm) and 0.5-4.0 Angstrom (0.05-0.4 nm) passbands. Data from the SWPC Primary and Secondary GOES X-ray satellites are shown. Some data dropouts from the Primary satellite will occur during satellite eclipses.
Other plots of interest: A black background version of this plot; GOES 1-min X-rays; SWPC Real-time Monitors.
SWPC X-ray alerts are issued at the M5 (5x10E-5 Watts/m2) and X1 (1x10E-4 Watts/m2) levels, based upon 1-minute data. Large X-ray bursts cause short wave fades for HF propagation paths through the sunlit hemisphere. Some large flares are accompanied by strong solar radio bursts that may interfere with satellite downlinks.
This page updates dynamically every 5 minutes.

3-day GOES Proton Flux plot
GOES 5-minute averaged integral proton flux (protons/cm2-s-sr) as measured by the SWPC primary GOES satellite for energy thresholds of >=10, >=50, and >=100 MeV. SWPC's proton event threshold is 10 protons/cm2-s-sr at >=10 MeV. Large particle fluxes have been associated with satellite single event upsets (SEUs).
This page updates dynamically every 5 minutes. Other SWPC Real-time Monitors
 SOURCE: http://www.swpc.noaa.gov/rt_plots/pro_3d.html


The three X-class flares that the sun emitted in under 24 hours on May 12-13, 2013. (NASA/SDO)
Sunday and Monday's flare were the 15th and 16th X-class flares of the solar cycle, and there are likely to be more through the end of the year as the sun reaches "solar maximum." The strongest flare of the cycle, an X6.9, occurred Aug. 9, 2011. Last year, a large flare temporarily knocked military satellites offline.


HOW CONVENIENT.  THE FOLLOWING IS AN ARTICLE FROM NASA....


Impacts of Strong Solar Flares
05.13.13


Given a legitimate need to protect Earth from the most intense forms of space weather -- great bursts of electromagnetic energy and particles that can sometimes stream from the sun -- some people worry that a gigantic "killer solar flare" could hurl enough energy to destroy Earth, but this is not actually possible.

Solar activity is indeed currently ramping up toward what is known as solar maximum, something that occurs approximately every 11 years. However, this same solar cycle has occurred over millennia so anyone over the age of 11 has already lived through such a solar maximum with no harm.

This is not to say that space weather can't affect our planet. The explosive heat of a solar flare can't make it all the way to our globe, but electromagnetic radiation and energetic particles certainly can. Solar flares can temporarily alter the upper atmosphere creating disruptions with signal transmission from, say, a GPS satellite to Earth causing it to be off by many yards. Another phenomenon produced by the sun could be even more disruptive. Known as a coronal mass ejection or CME these solar explosions propel bursts of particles and electromagnetic fluctuations into Earth's atmosphere. Those fluctuations could induce electric fluctuations at ground level that could blow out transformers in power grids. A CME's particles can also collide with crucial electronics onboard a satellite and disrupt its systems.

In an increasingly technological world, where almost everyone relies on cellphones, and GPS controls not just your in-car map system, but also airplane navigation and the extremely accurate clocks that govern financial transactions, space weather is a serious matter.

But it is a problem the same way hurricanes are a problem. One can protect oneself with advance information and proper precautions. During a hurricane watch, a homeowner can stay put … or he can seal up the house, turn off the electronics and get out of the way. Similarly, scientists at NASA and NOAA give warnings to electric companies, spacecraft operators and airline pilots before a CME comes to Earth so that these groups can take proper precautions. 

NOAA's Space Weather Prediction Center (http://swpc.noaa.gov) is the U.S. government’s official source for space weather forecasts, alerts, watches and warnings. Improving these predictive abilities the same way weather prediction has improved over the last few decades is one of the reasons NASA studies the sun and space weather. We can't ignore space weather, but we can take appropriate measures to protect ourselves.

And, even at their worst, the sun's flares are not physically capable of destroying Earth.
SOHO image of solar flare from 2003
The Solar and Heliospheric Observatory spacecraft captured this image of a solar flare as it erupted from the sun early on Nov 4, 2003. This was the most powerful flare measured with modern methods, classified as an X28.
Credit: ESA and NASA/SOHO

......................................end update.............................................
UPDATE:  THIS IS AN INTERESTING UPDATE BECAUSE IT HAS CHANGED WHILE I WAS DOING THE ORIGINAL BLOG POST...IN OTHER WORDS, I DIDN'T EVEN PUBLISH IT YET.


Solar wind
speed: 359.1 km/sec
density: 7.0 protons/cm3
explanation | more data Updated: Today at 2016 UT
X-ray Solar Flares
6-hr max: X2 
1605 UT May13 
24-hr: X2 
1605 UT May13 
explanation | more data Updated: Today at: 2000 UT

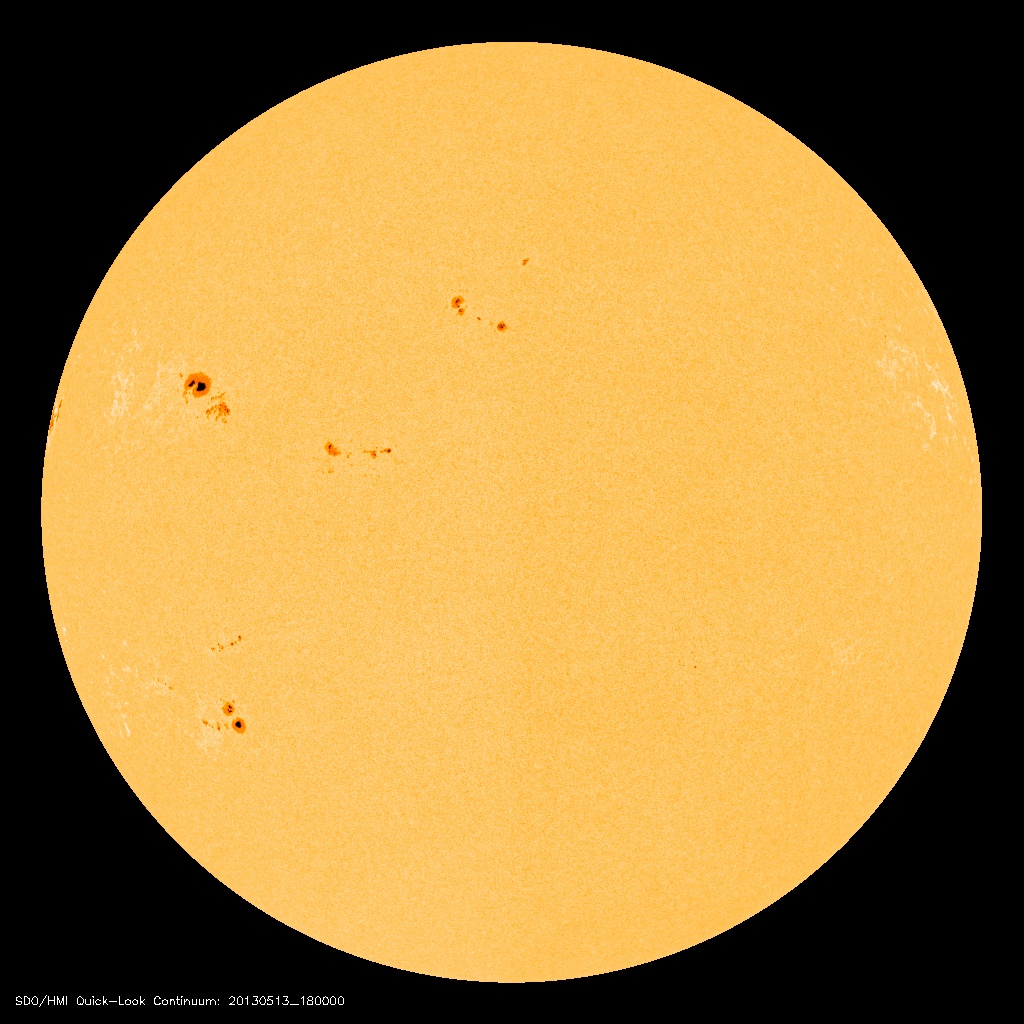
SOLAR ACTIVITY SURGES: A sunspot on the sun's eastern limb is crackling with powerful X-class solar flares. It announced itself with an X1.7-class eruption on May 13th at 0217 UT, quickly followed by an X2.8-class flare at 1609 UT. These are the strongest flares of 2013, and they signal a significant uptick in solar activity. More eruptions are in the offing.


SOLAR ACTIVITY SURGES: A sunspot on the sun's eastern limb is crackling with powerful X-class solar flares. It announced itself with an X1.7-class eruption on May 13th at 0217 UT, quickly followed by an X2.8-class flare at 1609 UT. These are the strongest flares of 2013, and they signal a significant uptick in solar activity. More eruptions are in the offing.

Both of today's flares have produced strong flashes of extreme ultraviolet radiation. Here is the view of the X1.7-flare from NASA's Solar Dynamics Observatory:


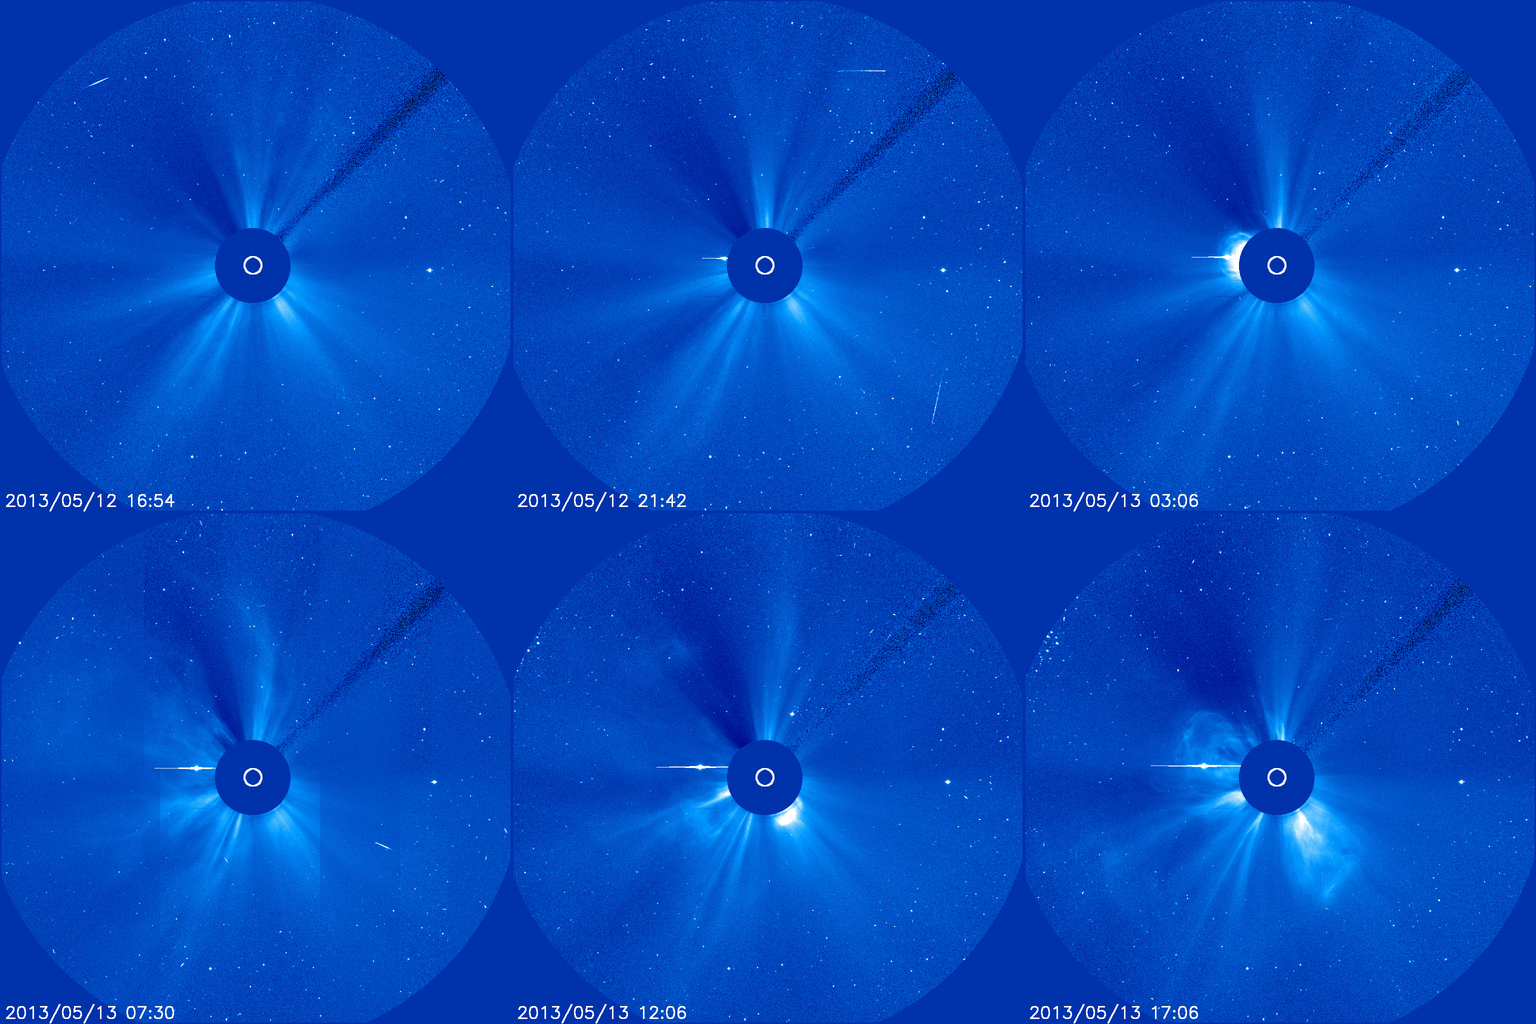
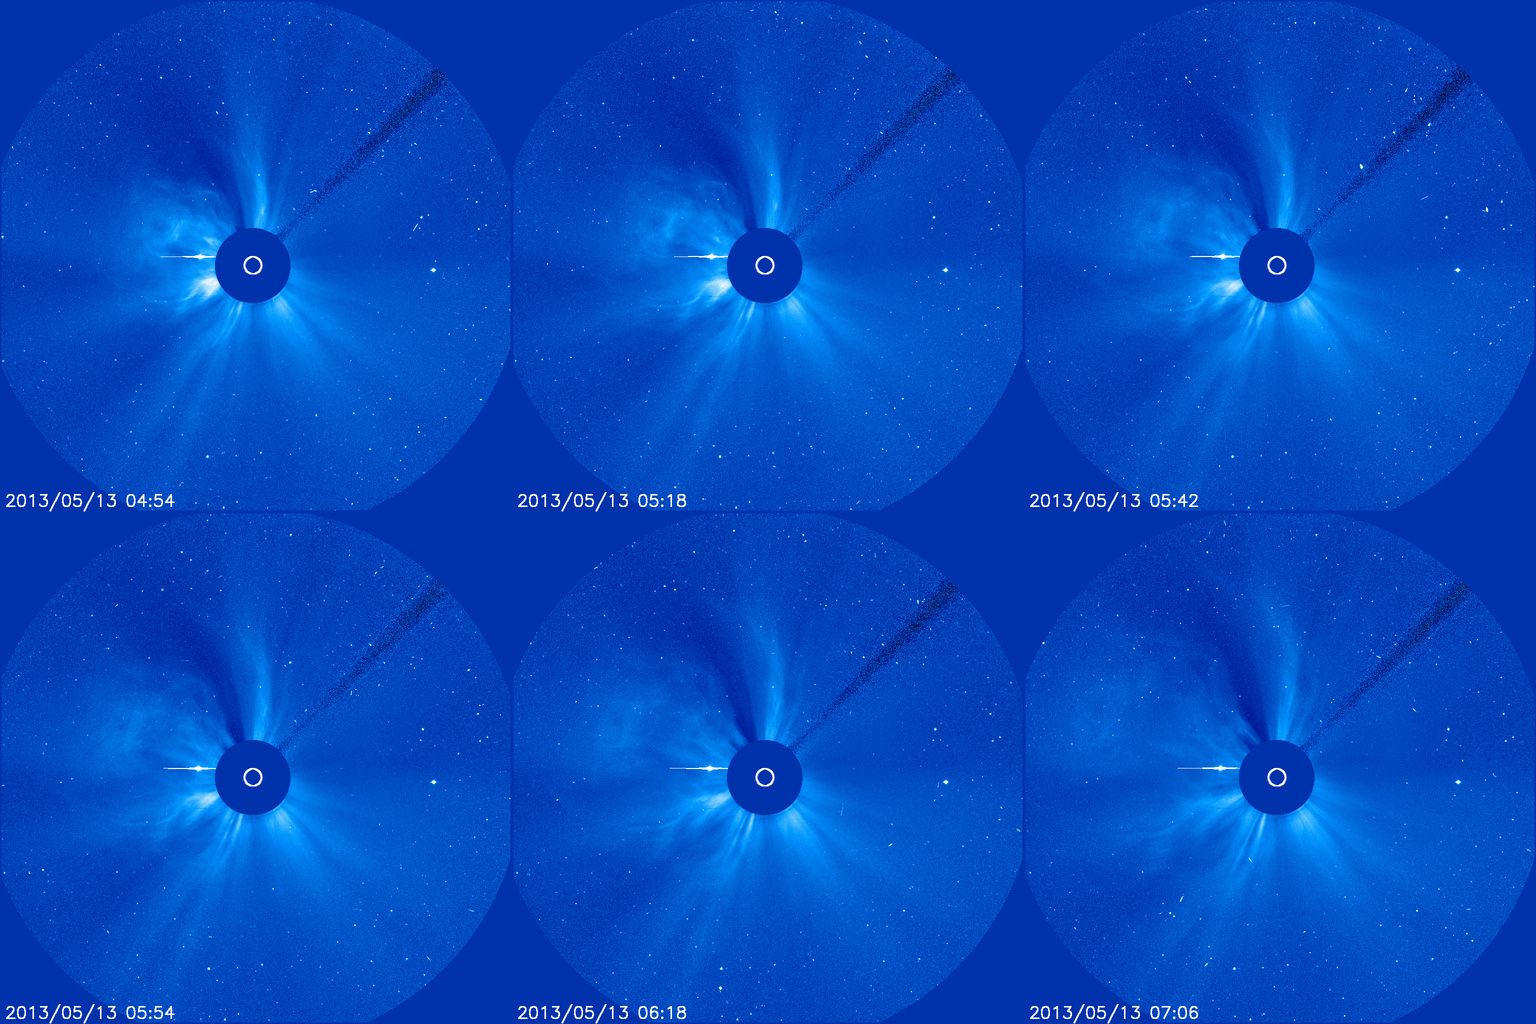
The explosions also hurled coronal mass ejections (CMEs) into space. Coronagraphs onboard the Solar and Heliospheric Observatory are tracking the clouds: movie. The planet in the CME movie is Mercury. Although the CMEs appear to hit Mercury, they do not. In fact, no planets were in the line of fire. However, the CMEs appear to be on course to hit NASA's Epoxi and Spitzer spacecraft on May 15-16.

When the flaring began, the sunspot was hidden behind the sun's eastern limb, but now solar rotation is bringing the active region into view. The Solar and Heliospheric Observatory captured this first look during the waning hours of May 13th:


The next 24 to 48 hours should reveal much about the sunspot, including its size, magnetic complexity, and potential for future flares. For the moment, there is no reason to expect the explosions to stop. 

SPACE WEATHERNOAA Forecasts
Updated at: 2013 May 12 2200 UTC
FLARE
0-24 hr
24-48 hr
CLASS M
50 %
50 %
CLASS X
05 %
05 %


Geomagnetic Storms:Probabilities for significant disturbances in Earth's magnetic field are given for three activity levels:activeminor stormsevere storm
Updated at: 2013 May 12 2200 UTC
Mid-latitudes
0-24 hr
24-48 hr
ACTIVE
15 %
10 %
MINOR
05 %
01 %
SEVERE
01 %
01 %
High latitudes
0-24 hr
24-48 hr
ACTIVE
15 %
15 %
MINOR
25 %
15 %
SEVERE
25 %
10 %


....................end update..................................
X-FLARE #1: A sunspot hiding behind the sun's northeastern limb erupted on May 13th at 02:17 UT, producing an X1.7-class solar flare. NASA's Solar Dynamics Observatory recorded the explosion's extreme ultraviolet flash:


Coronagraphs on board the Solar and Heliospheric Observatory (SOHO) tracked a bright CME emerging from the blast site: movie. No planets were in the line of fire. However, the CME appears to be on course to hit NASA's Epoxi and Spitzer spacecraft on May 15th.

The sunspot that produced this blast is on the far side of the sun. Soon, in a few days, it will turn toward Earth, emerging into view over the sun's eastern limb. Stay tuned for a better view and, perhaps, more flares.

ANOTHER X-FLARE: Earth-orbiting satellites have just detected another X-class solar flare issuing from a sunspot hidden behind the sun's eastern limb. This latest blast, measuring X2.8 on the Richter Scale of Solar Flares, is the second one today and the strongest flare of the year so far. Stay tuned for updates

The Classification of X-ray Solar Flares
or "Solar Flare Alphabet Soup"
A solar flare is an explosion on the Sun that happens when energy stored in twisted magnetic fields (usually above sunspots) is suddenly released. Flares produce a burst of radiation across the electromagnetic spectrum, from radio waves to x-rays and gamma-rays. [more information]
Scientists classify solar flares according to their x-ray brightness in the wavelength range 1 to 8 Angstroms. There are 3 categories: X-class flares are big; they are major events that can trigger planet-wide radio blackouts and long-lasting radiation storms. M-class flares are medium-sized; they can cause brief radio blackouts that affect Earth's polar regions. Minor radiation storms sometimes follow an M-class flare. Compared to X- and M-class events, C-class flares are small with few noticeable consequences here on Earth.
This figure shows a series of solar flares detected by NOAA satellites in July 2000:
 
Each category for x-ray flares has nine subdivisions ranging from, e.g., C1 to C9, M1 to M9, and X1 to X9. In this figure, the three indicated flares registered (from left to right) X2, M5, and X6. The X6 flare triggered a radiation storm around Earth nicknamed the Bastille Day event.

 Class
Peak (W/m2)between 1 and 8 Angstroms

 B
 I < 10-6

 C
 10-6 < = I < 10-5

 M
 10-5 < = I < 10-4

 X
 I > = 10-4

SOURCE: http://spaceweather.com/glossary/flareclasses.html
CURRENT AURORAL OVAL
FIND MORE INFORMATION ON THE ABOVE HERE... http://hfradio.org/aurora_globe.html
3-day GOES X-ray Plot
SOURCE: http://www.swpc.noaa.gov/rt_plots/index.html