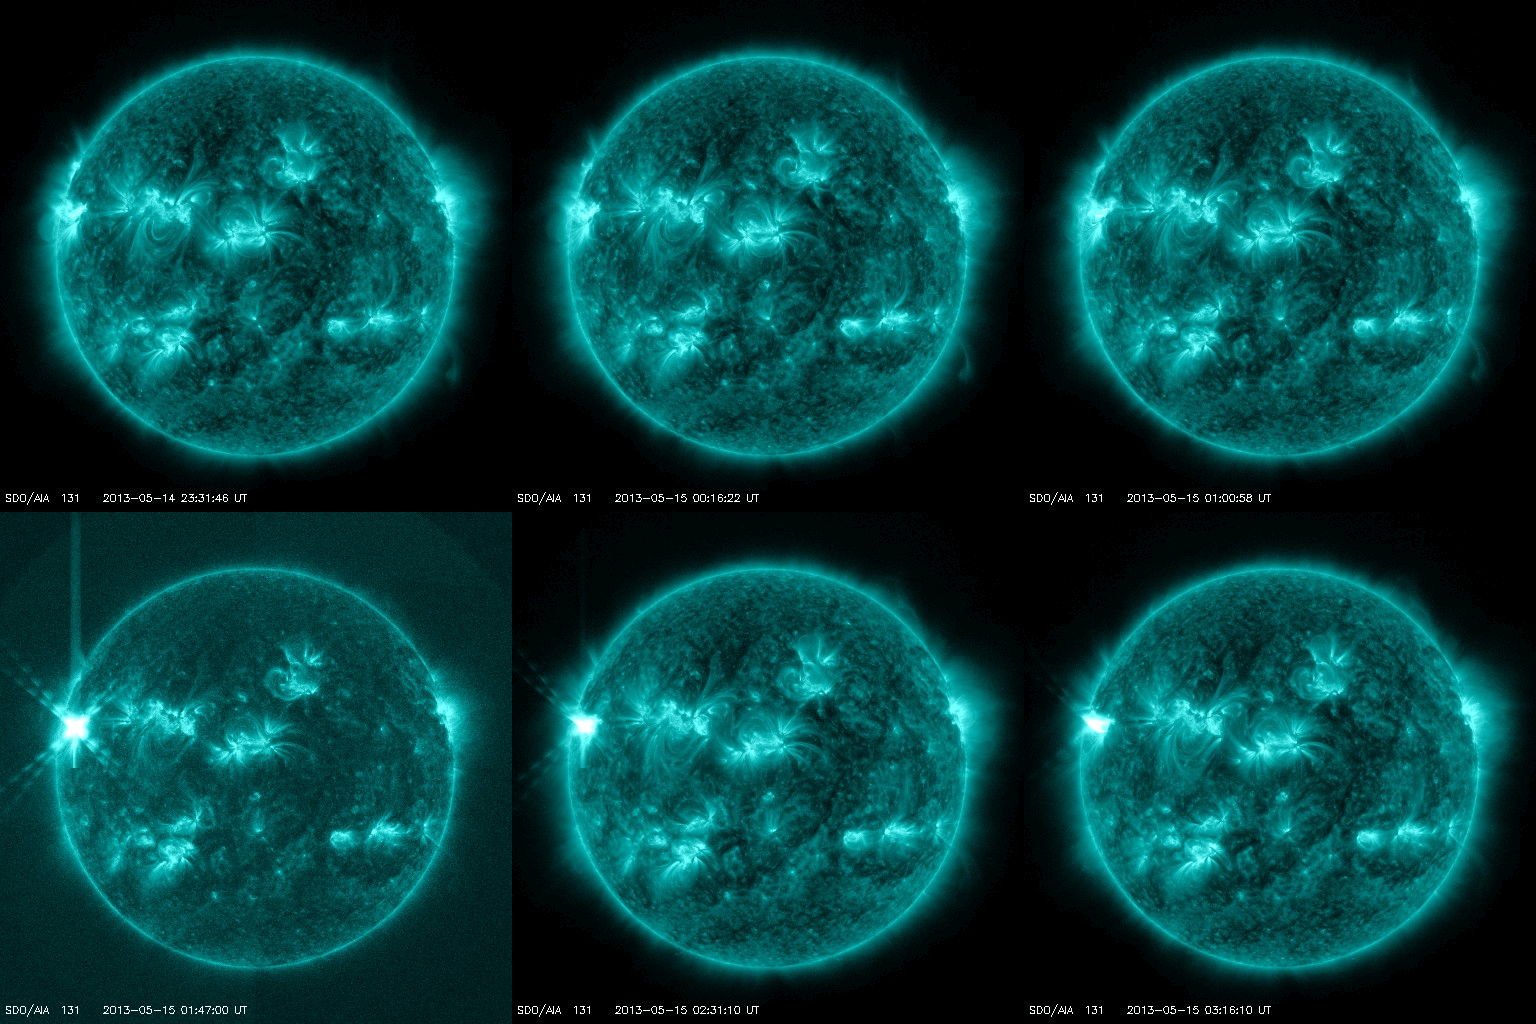
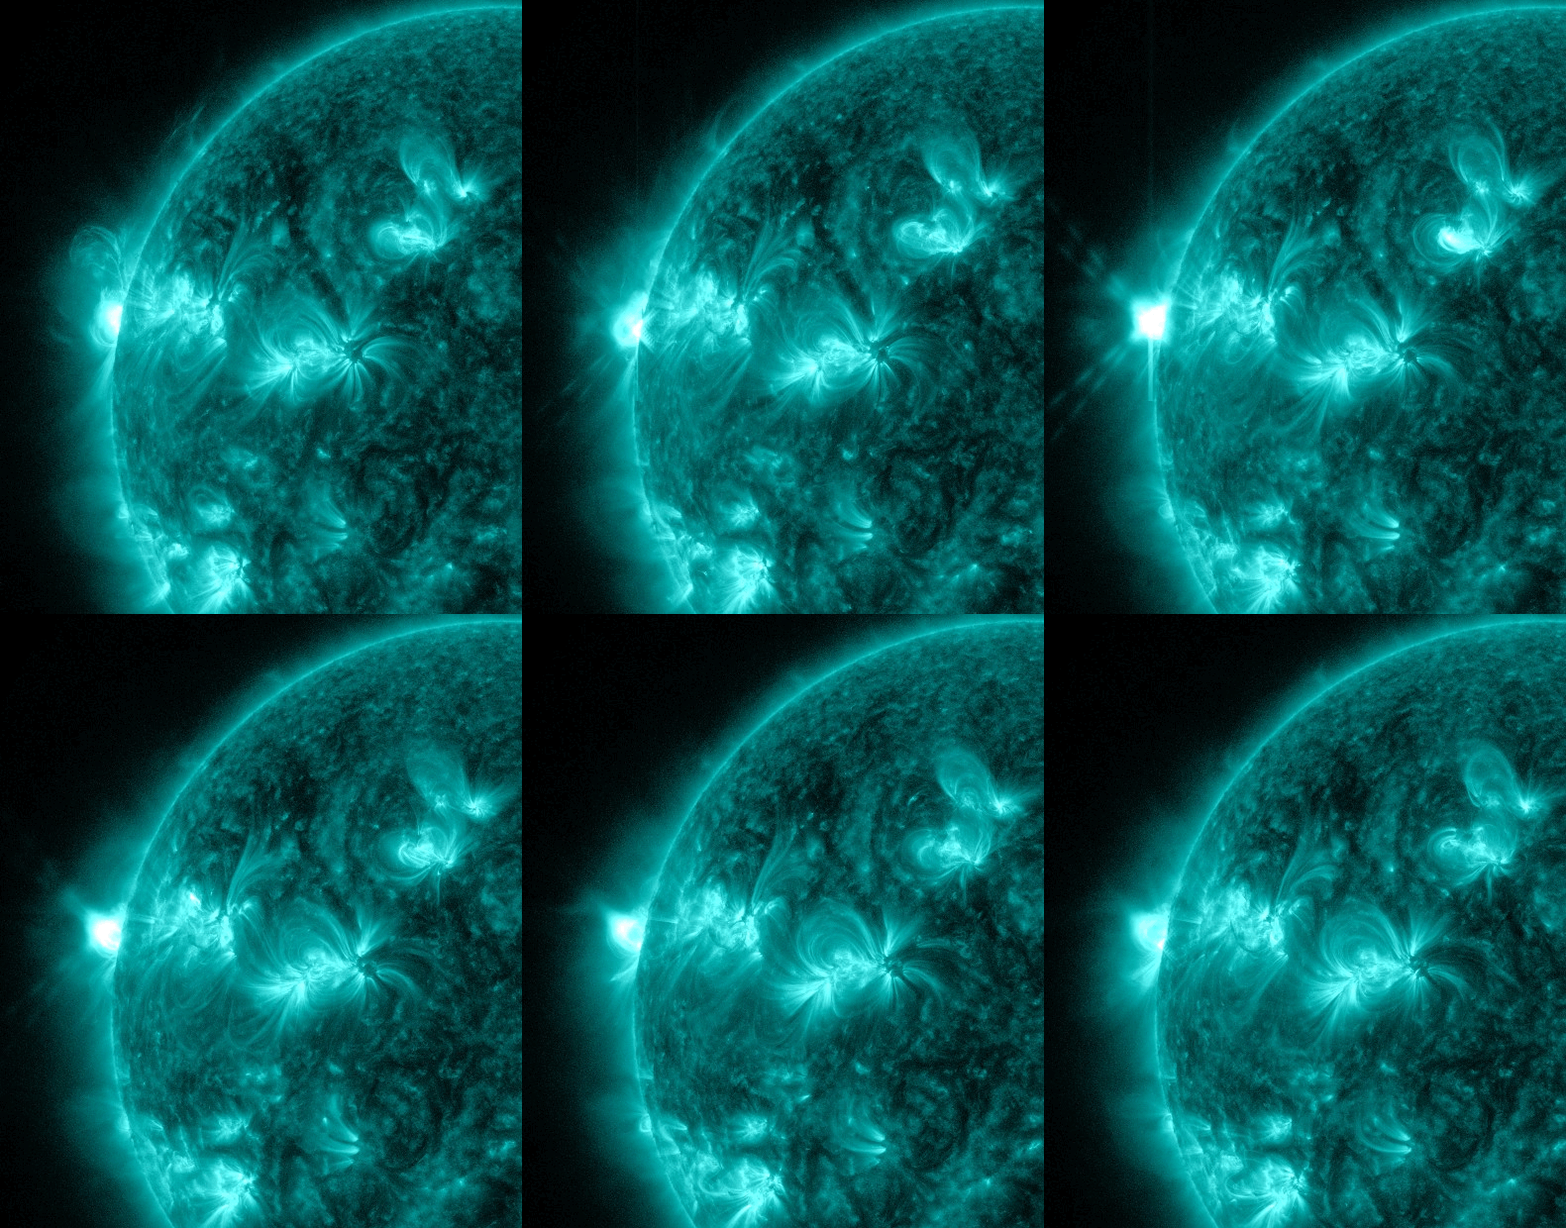
ANOTHER X-FLARE ON MAY 15: When the week began, the sun hadn't unleashed an X-flare all year long. In only two days, sunspot AR1748 has produced four. The latest X-flare from this active sunspot occured on May 15th at 0152 UT. NASA's Solar Dynamics Observatory captured the extreme ultraviolet flash:
Although the sunspot is not directly facing Earth, this flare might have produced a CME with an Earth-directed component. We are waiting for coronagraph data from SOHO and the twin STEREO probes to check this possibility. Stay tuned for updates.
In summary, AR1748 has produced an X1.7-class flare (0217 UT on May 13), anX2.8-class flare (1609 UT on May 13), an X3.2-class flare (0117 UT on May 14), and an X1-class flare (0152 on May 15). These are the strongest flares of the year, and they signal a significant increase in solar activity

| SPACE WEATHERNOAA Forecasts |
|
Updated at: 2013 May 14 2200 UTC
FLARE
|
0-24 hr
|
24-48 hr
|
CLASS M
|
80 %
|
80 %
|
CLASS X
|
50 %
|
50 %
|

.....................................end update..........................................................
UPDATE 3-14-2013
IF ANY OF YOU SAW AN X20+ FLARE TO THE LEFT ON THE SIDEBAR AT SPACEWEATHER.COM AND STARTED TO PANIC...
(UNDER "CURRENT CONDITIONS")
...CACHED COPY...
X-ray Solar Flares
6-hr max: X20+ 5 UT May14
24-hr: X20+ UT May14
explanation | more dataUpdated: Today at: UT
...THIS HAS BEEN CORRECTED, THANK GOODNESS. A PANIC HAPPENED REGARDING THIS IN 2011 AS WELL. Not to worry. It has been corrected. However, let us remember when a huge X-class flare hit the Earth in 1989.
Now we have this from SpaceWeather.com
Solar wind
speed: -9999.9 km/sec
density: 2.3 protons/cm3explanation | more dataUpdated: Today at 1614 UT
Something is definitely up to something on their site!!!!
Here are the flares for today...
Solar flares today
Today, 2 solar flares were observed:
| | Active region | Begin, UT | Max, UT | End, UT |
|---|
 | Flare of class X3.2 | 1748 | 00:00:00 | 01:11:00 | 01:20:00 |
|
 | Flare of class C1.8 | 1748 | 12:18:00 | 12:22:00 | 12:24:00 |
|
Solar flares yesterday
Yesterday, 14 solar flares were observed:
| | Active region | Begin, UT | Max, UT | End, UT |
|---|
| Flare of class C9.3 | 1748 | 00:32:00 | 00:39:00 | 00:46:00 |
|
| Flare of class X1.7 | 1748 | 01:53:00 | 02:17:00 | 02:32:00 |
|
| Flare of class C2.4 | 0 | 07:02:00 | 07:06:00 | 07:09:00 |
|
| Flare of class C2.0 | 0 | 08:02:00 | 08:07:00 | 08:11:00 |
|
| Flare of class C4.5 | 1745 | 08:35:00 | 08:38:00 | 08:44:00 |
|
| Flare of class C2.8 | 1748 | 09:24:00 | 09:29:00 | 09:37:00 |
|
| Flare of class C1.7 | 0 | 10:34:00 | 10:37:00 | 10:40:00 |
|
 | Flare of class M1.3 | 1748 | 11:57:00 | 12:03:00 | 12:09:00 |
|
| Flare of class C4.0 | 1748 | 12:47:00 | 12:52:00 | 13:00:00 |
|
| Flare of class C5.3 | 1748 | 13:55:00 | 14:40:00 | 15:10:00 |
|
| Flare of class X2.8 | 1748 | 15:48:00 | 16:05:00 | 16:16:00 |
|
| Flare of class C2.9 | 1748 | 21:26:00 | 21:29:00 | 21:34:00 |
|
| Flare of class C8.3 | 1745 | 21:58:00 | 22:05:00 | 22:11:00 |
|
| Flare of class X3.2 | 1748 | 00:00:00 | 01:11:00 | 01:20:00 |
source: http://www.tesis.lebedev.ru/en/sun_flares.html |
Monday was the Sun’s angriest day in years
By Tariq Malik
Published May 14, 2013
-
This image shows an X3.2 solar flare (far left) erupting from the sun late Monday (May 13, 2013) as seen by NASA's Solar Dynamics Observatory. It was the third major X-class solar flare in 24 hours. (NASA/SDO)
The sun, it seems, is in overdrive. Late Monday night, the sun unleashed its third major solar flare in 24 hours — the biggest and most powerful solar storm of the year, so far.
This latest sun storm erupted Monday (May 13) at 9:11 p.m. EDT (0111 GMT) and registered as an X3.2 solar flare, one of the strongest types of flares the sun can release, space weather officials said. It came on the heels of two other recent X-class solar flares on Sunday night and Monday, all of which were sparked by a highly active sunspot on the sun's far left side.
'Clearly an extraordinary active region is making its way fully onto the visible disk.'
- NOAA Space Weather Prediction Center officials
Officials at the NOAA Space Weather Prediction Center in Boulder, Colo., appeared amazed at the intense activity from the crackling sunspot.
"Clearly an extraordinary active region is making its way fully onto the visible disk," SWPC officials wrote in a morning update today (May 14). "Can it keep up this hectic pace?"
Two of the three recent solar flares have been associated with massive explosions, called coronal mass ejections, which flung super-hot solar material into space at millions of miles per hour. Because the sunspot firing off the flares is not yet facing Earth, the solar eruptions pose no threat to satellites and astronauts in orbit, NASA has said.
"This marks the 3rd X-class flare in 24 hours," officials with NASA's sun-watching Solar Dynamics Observatory wrote in a statement. "Just like the two before this one also happened over the eastern limb of the sun and is not Earth-directed."
According to astronomer Tony Phillips of Spaceweather.com, scientists have just given the active sunspot a name: AR1748. It is one of nine active numbered sunspots currently visible on the surface of the sun.
While AR1784 has been spouting off many solar flares in recent days, most of them more moderate, M-class solar flares, the events on Sunday and Monday are taking solar activity to another level.
"These are the strongest flares of the year so far, and they signal a significant increase in solar activity," Phillips wrote in a Spaceweather.com update this morning.
- MEASURING SOLAR FLARES
Scientists use a tiered scale to measure the brightness of X-ray events and detail their effect on high-frequency radio signals:
M1: Minor. Weak or minor degradation of radio communication on sunlit side, occasional loss of radio contact.
M5: Moderate. Limited radio blackout on sunlit side, loss of contact for tens of minutes.
X1: Strong. Wide area blackout, loss of radio contact for about an hour on sunlit side of Earth.
X10: Severe. Radio blackout on most of the sunlit side of Earth for one to two hours.
X20: Extreme. Complete radio blackout lasting for a number of hours. This results in no radio contact with mariners and en route aviators.
Scientists use a tiered
space weather
scale to classify solar flare events, with each level representing a tenfold increase in power over the one before. At the bottom of the scale are A and B type solar flares, which have no effect on Earth. Next are C-class solar flares and the stronger, yet still medium-strength, M-class solar flares, which can supercharge Earth's auroras and cause radio blackouts when aimed at Earth.
X-class solar flares are the most powerful types of solar storms. When aimed directly at Earth, these major solar events can pose a danger to astronauts and satellites in space, as well as interfere with radio and GPS navigation signals.
The X3.2 solar flare is the most powerful yet seen this year and the third-strongest sun storm of the current 11-year solar cycle, called Solar Cycle 24. The second strongest was an X5.4 solar flare in 2012, while the largest event was an X6.9 flare in 2011. So far, there have been 18 X-class solar flares in Solar Cycle 24.
The first X-class solar flare of 2013 (the Sunday event) registered as an X1.7 on the flare scale, with the mid-day Monday flare rating as an X2.8, NASA officials said.
Solar activity on the sun rises and falls over the course of its 11-year cycle. The sun is active phase of Solar Cycle 24 as it approaches its peak activity period, called
solar maximum, which is expected to occur later this year.
Scientists have been monitoring solar flares and other space weather events since their discovery in 1843. Today, NASA and other space agencies continuously monitor the sun with spacecraft like the Solar Dynamics Observatory to track potentially dangerous space weather events.
Read more: http://www.foxnews.com/science/2013/05/14/hyperactive-sun-fires-off-3-major-solar-flares-in-1-day/#ixzz2TIHiLuNU

SOURCE:
http://www.swpc.noaa.gov/rt_plots/Xray.gif
The GOES X-ray Flux plot contains 5 minute averages of solar X-ray output in the 1-8 Angstrom (0.1-0.8 nm) and 0.5-4.0 Angstrom (0.05-0.4 nm) passbands. Data from the SWPC Primary and Secondary GOES X-ray satellites are shown. Some data dropouts from the Primary satellite will occur during satellite eclipses.
SWPC X-ray alerts are issued at the M5 (5x10E-5 Watts/m2) and X1 (1x10E-4 Watts/m2) levels, based upon 1-minute data. Large X-ray bursts cause short wave fades for HF propagation paths through the sunlit hemisphere. Some large flares are accompanied by strong solar radio bursts that may interfere with satellite downlinks.
This page updates dynamically every 5 minutes.
GOES 5-minute averaged integral proton flux (protons/cm2-s-sr) as measured by the SWPC primary GOES satellite for energy thresholds of >=10, >=50, and >=100 MeV. SWPC's proton event threshold is 10 protons/cm2-s-sr at >=10 MeV. Large particle fluxes have been associated with satellite single event upsets (SEUs).
This page updates dynamically every 5 minutes. Other SWPC
Real-time Monitors
SOURCE: http://www.swpc.noaa.gov/rt_plots/pro_3d.html
Sunday and Monday's flare were the 15th and 16th X-class flares of the solar cycle, and there are likely to be more through the end of the year as the sun reaches "solar maximum." The strongest flare of the cycle, an X6.9, occurred Aug. 9, 2011. Last year, a large flare temporarily knocked military satellites offline.
HOW CONVENIENT. THE FOLLOWING IS AN ARTICLE FROM NASA....
Impacts of Strong Solar Flares
05.13.13
Given a legitimate need to protect Earth from the most intense forms of space weather -- great bursts of electromagnetic energy and particles that can sometimes stream from the sun -- some people worry that a gigantic "killer solar flare" could hurl enough energy to destroy Earth, but this is not actually possible.
Solar activity is indeed currently ramping up toward what is known as solar maximum, something that occurs approximately every 11 years. However, this same solar cycle has occurred over millennia so anyone over the age of 11 has already lived through such a solar maximum with no harm.
This is not to say that space weather can't affect our planet. The explosive heat of a solar flare can't make it all the way to our globe, but electromagnetic radiation and energetic particles certainly can. Solar flares can temporarily alter the upper atmosphere creating disruptions with signal transmission from, say, a GPS satellite to Earth causing it to be off by many yards. Another phenomenon produced by the sun could be even more disruptive. Known as a coronal mass ejection or CME these solar explosions propel bursts of particles and electromagnetic fluctuations into Earth's atmosphere. Those fluctuations could induce electric fluctuations at ground level that could blow out transformers in power grids. A CME's particles can also collide with crucial electronics onboard a satellite and disrupt its systems.
In an increasingly technological world, where almost everyone relies on cellphones, and GPS controls not just your in-car map system, but also airplane navigation and the extremely accurate clocks that govern financial transactions, space weather is a serious matter.
But it is a problem the same way hurricanes are a problem. One can protect oneself with advance information and proper precautions. During a hurricane watch, a homeowner can stay put … or he can seal up the house, turn off the electronics and get out of the way. Similarly, scientists at NASA and NOAA give warnings to electric companies, spacecraft operators and airline pilots before a CME comes to Earth so that these groups can take proper precautions.
NOAA's Space Weather Prediction Center (http://swpc.noaa.gov) is the U.S. government’s official source for space weather forecasts, alerts, watches and warnings. Improving these predictive abilities the same way weather prediction has improved over the last few decades is one of the reasons NASA studies the sun and space weather. We can't ignore space weather, but we can take appropriate measures to protect ourselves.
And, even at their worst, the sun's flares are not physically capable of destroying Earth.

The Solar and Heliospheric Observatory spacecraft captured this image of a solar flare as it erupted from the sun early on Nov 4, 2003. This was the most powerful flare measured with modern methods, classified as an X28.
Credit: ESA and NASA/SOHO
......................................end update.............................................
UPDATE: THIS IS AN INTERESTING UPDATE BECAUSE IT HAS CHANGED WHILE I WAS DOING THE ORIGINAL BLOG POST...IN OTHER WORDS, I DIDN'T EVEN PUBLISH IT YET.
 Solar wind
speed: 359.1 km/sec
density: 7.0 protons/cm3explanation | more data Updated: Today at 2016 UT
X-ray Solar Flares
6-hr max: X2 1605 UT May13
24-hr: X2 1605 UT May13
explanation | more data Updated: Today at: 2000 UT
SOLAR ACTIVITY SURGES: A sunspot on the sun's eastern limb is crackling with powerful X-class solar flares. It announced itself with an X1.7-class eruption on May 13th at 0217 UT, quickly followed by an X2.8-class flare at 1609 UT. These are the strongest flares of 2013, and they signal a significant uptick in solar activity. More eruptions are in the offing.
SOLAR ACTIVITY SURGES: A sunspot on the sun's eastern limb is crackling with powerful X-class solar flares. It announced itself with an
X1.7-class eruption on May 13th at 0217 UT, quickly followed by an
X2.8-class flare at 1609 UT. These are the strongest flares of 2013, and they signal a significant uptick in solar activity. More eruptions are in the offing.
Both of today's flares have produced strong flashes of extreme ultraviolet radiation. Here is the view of the X1.7-flare from NASA's Solar Dynamics Observatory:
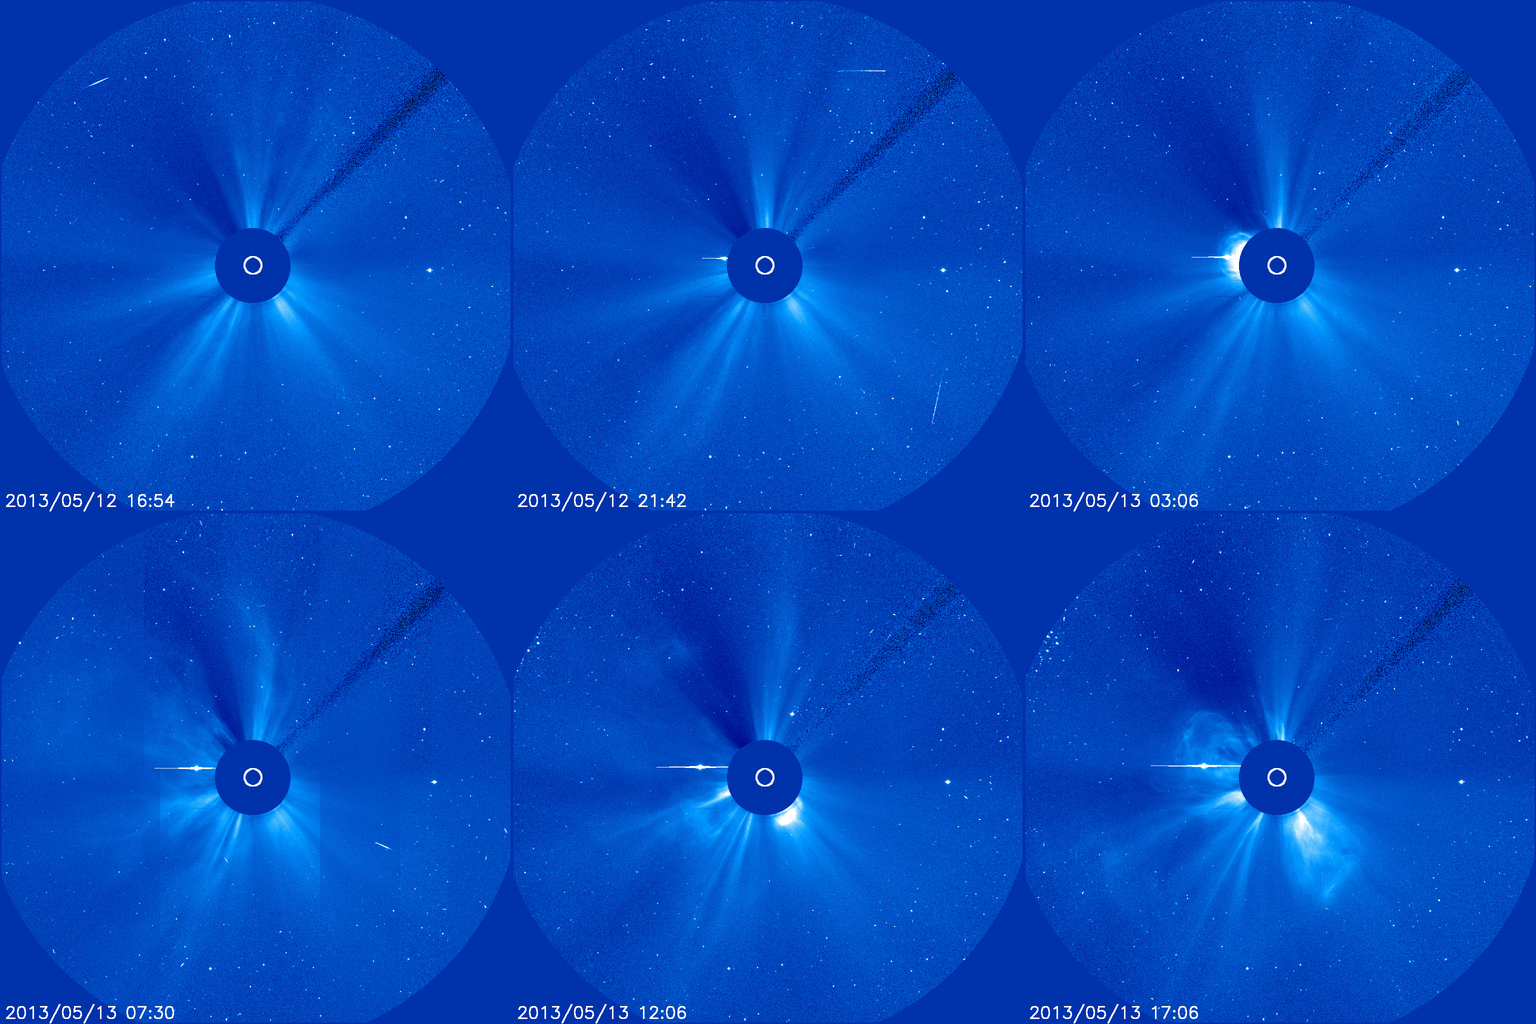
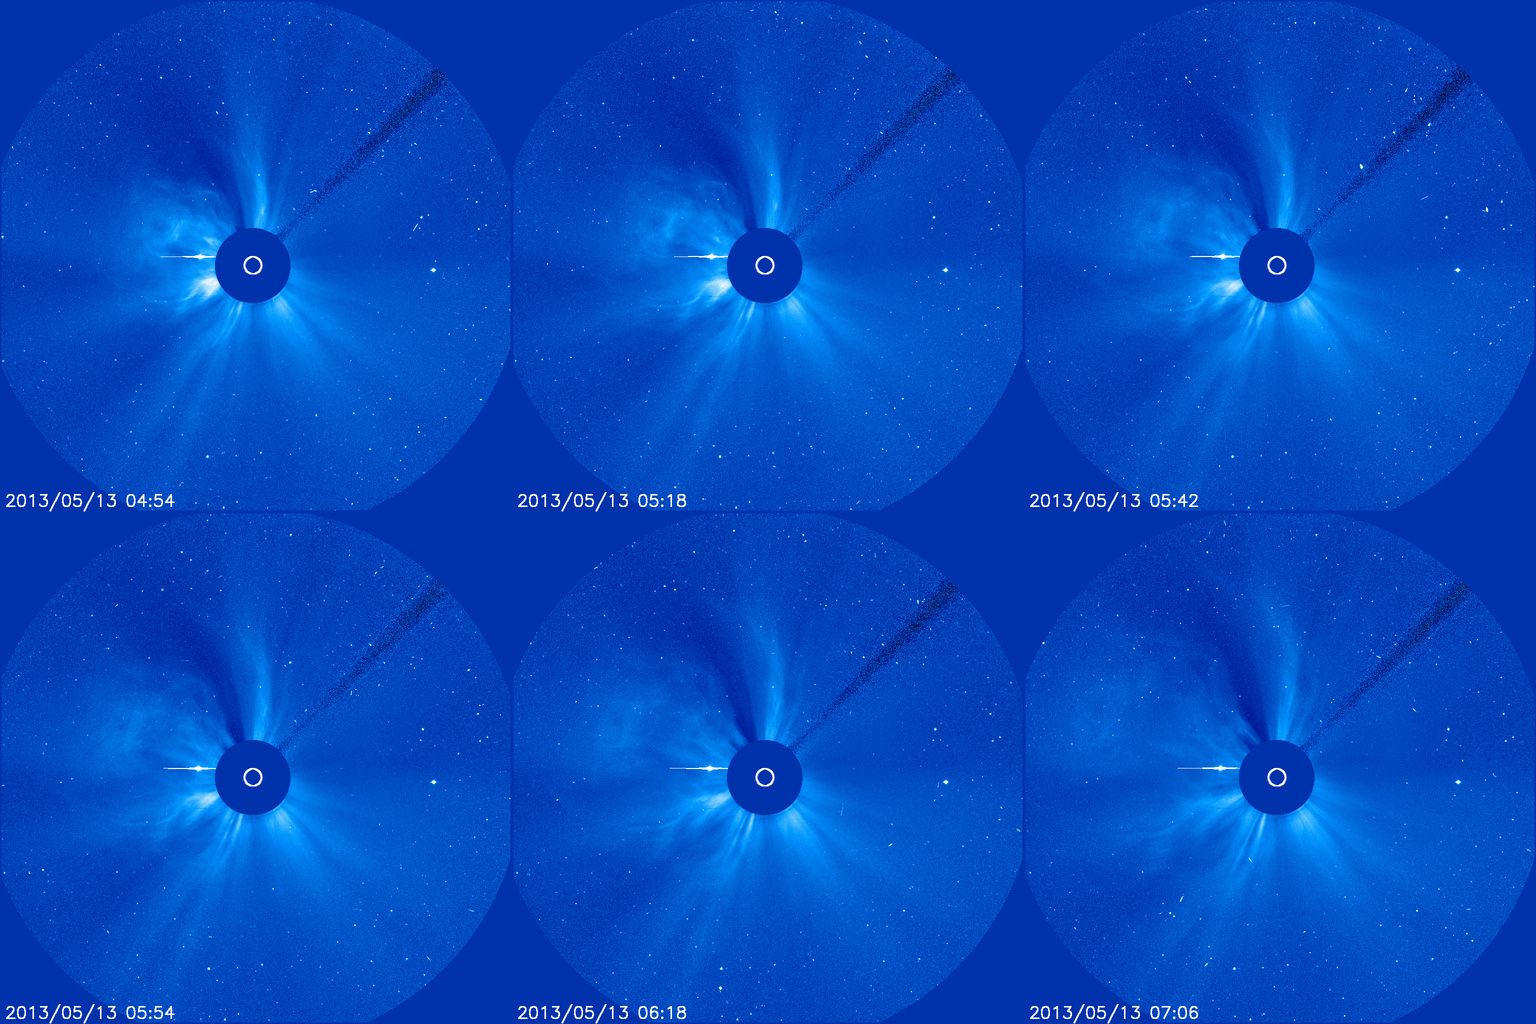
The explosions also hurled coronal mass ejections (CMEs) into space. Coronagraphs onboard the Solar and Heliospheric Observatory are tracking the clouds:
movie. The planet in the CME movie is Mercury. Although the CMEs appear to hit Mercury, they do not. In fact, no planets were in the line of fire. However, the CMEs appear to be on course to hit NASA's Epoxi and Spitzer spacecraft on May 15-16.
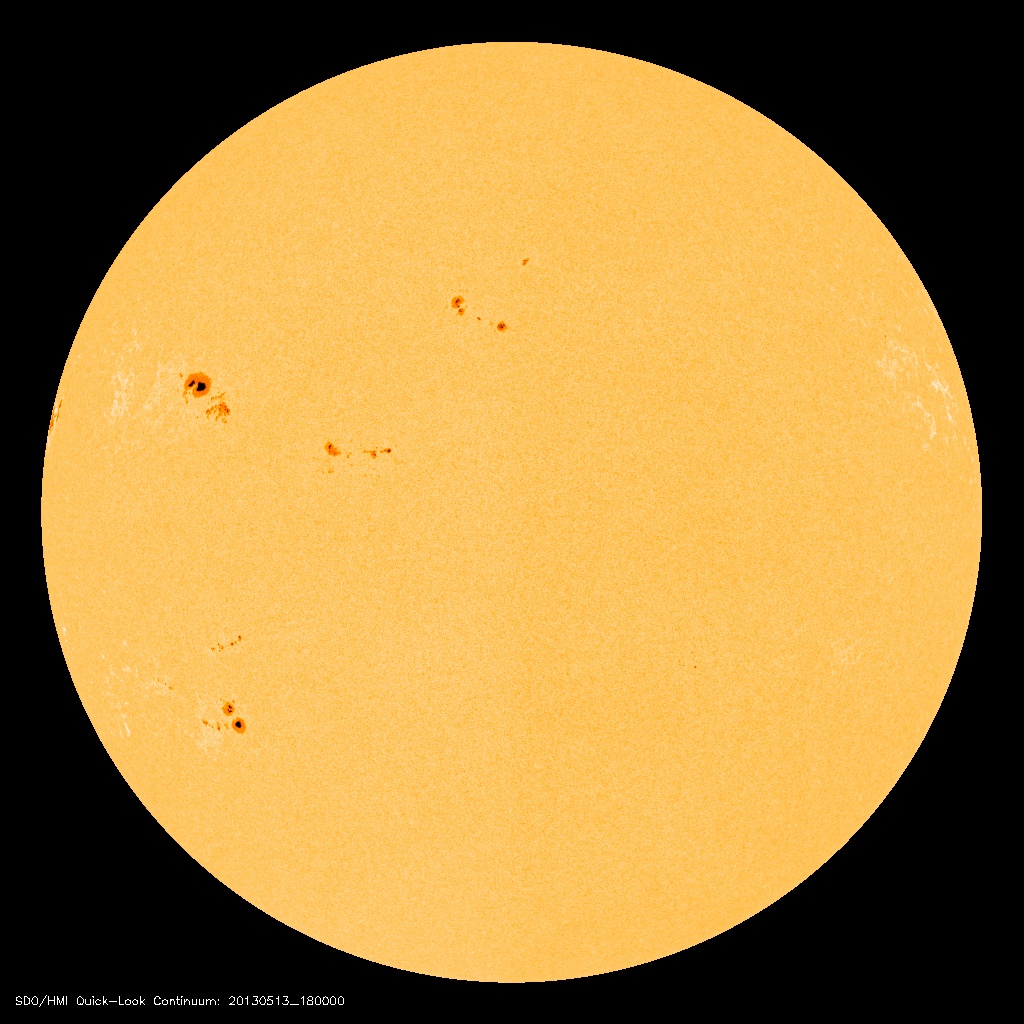
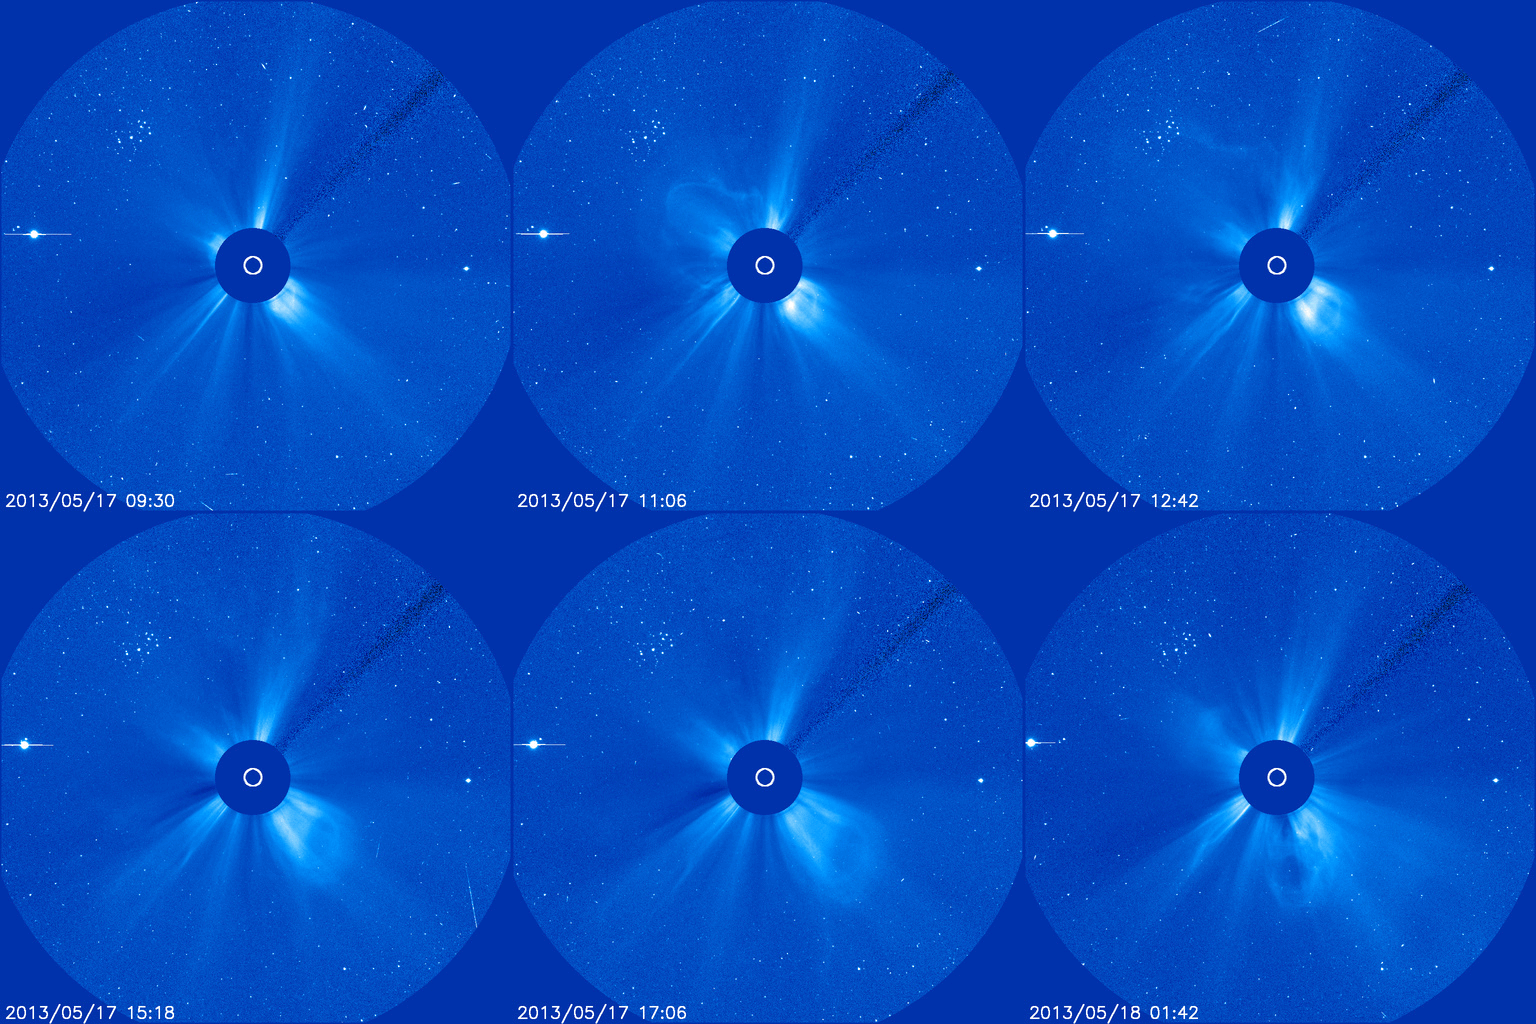
When the flaring began, the sunspot was hidden behind the sun's eastern limb, but now solar rotation is bringing the active region into view. The Solar and Heliospheric Observatory captured this first look during the waning hours of May 13th:
The next 24 to 48 hours should reveal much about the sunspot, including its size, magnetic complexity, and potential for future flares. For the moment, there is no reason to expect the explosions to stop.
| SPACE WEATHERNOAA Forecasts |
|
Updated at: 2013 May 12 2200 UTC
FLARE
|
0-24 hr
|
24-48 hr
|
CLASS M
|
50 %
|
50 %
|
CLASS X
|
05 %
|
05 %
|

Geomagnetic Storms:Probabilities for significant disturbances in Earth's magnetic field are given for three activity levels:active, minor storm, severe storm
Updated at: 2013 May 12 2200 UTC
Mid-latitudes
|
0-24 hr
|
24-48 hr
|
ACTIVE
|
15 %
|
10 %
|
MINOR
|
05 %
|
01 %
|
SEVERE
|
01 %
|
01 %
|
High latitudes
|
0-24 hr
|
24-48 hr
|
ACTIVE
|
15 %
|
15 %
|
MINOR
|
25 %
|
15 %
|
SEVERE
|
25 %
|
10 %
|
| |
|
....................end update..................................
X-FLARE #1: A sunspot hiding behind the sun's northeastern limb erupted on May 13th at 02:17 UT, producing an X1.7-class solar flare. NASA's Solar Dynamics Observatory recorded the explosion's extreme ultraviolet flash:
Coronagraphs on board the Solar and Heliospheric Observatory (SOHO) tracked a bright CME emerging from the blast site:
movie. No planets were in the line of fire. However, the CME appears to be on course to hit NASA's Epoxi and Spitzer spacecraft on May 15th.
The sunspot that produced this blast is on the far side of the sun. Soon, in a few days, it will turn toward Earth, emerging into view over the sun's eastern limb. Stay tuned for a better view and, perhaps, more flares.
ANOTHER X-FLARE: Earth-orbiting satellites have just detected another X-class solar flare issuing from a sunspot hidden behind the sun's eastern limb. This latest blast, measuring X2.8 on the Richter Scale of Solar Flares, is the second one today and the strongest flare of the year so far. Stay tuned for updates
The Classification of X-ray Solar Flares
or "Solar Flare Alphabet Soup"
A solar flare is an explosion on the Sun that happens when energy stored in twisted magnetic fields (usually above sunspots) is suddenly released. Flares produce a burst of radiation across the electromagnetic spectrum, from radio waves to x-rays and gamma-rays. [more information]
Scientists classify solar flares according to their x-ray brightness in the wavelength range 1 to 8 Angstroms. There are 3 categories: X-class flares are big; they are major events that can trigger planet-wide radio blackouts and long-lasting radiation storms. M-class flares are medium-sized; they can cause brief radio blackouts that affect Earth's polar regions. Minor radiation storms sometimes follow an M-class flare. Compared to X- and M-class events, C-class flares are small with few noticeable consequences here on Earth.
This figure shows a series of solar flares detected by NOAA satellites in July 2000:

Each category for x-ray flares has nine subdivisions ranging from, e.g., C1 to C9, M1 to M9, and X1 to X9. In this figure, the three indicated flares registered (from left to right) X2, M5, and X6. The X6 flare triggered a radiation storm around Earth nicknamed the Bastille Day event.
| Class | Peak (W/m2)between 1 and 8 Angstroms
|
B
| I < 10-6 |
C
| 10-6 < = I < 10-5 |
M
| 10-5 < = I < 10-4 |
X
| I > = 10-4 |
SOURCE: http://spaceweather.com/glossary/flareclasses.html
CURRENT AURORAL OVAL
 FIND MORE INFORMATION ON THE ABOVE HERE... http://hfradio.org/aurora_globe.html
SOURCE: http://www.swpc.noaa.gov/rt_plots/index.html
FIND MORE INFORMATION ON THE ABOVE HERE... http://hfradio.org/aurora_globe.html
SOURCE: http://www.swpc.noaa.gov/rt_plots/index.html

 Holmes' lawyers repeatedly have said he is mentally ill, but they delayed the insanity plea while arguing state laws were unconstitutional. They said the laws could hobble the defense if Holmes' case should ever reach the phase where the jury decides if he should be executed.
 The dead included a Navy veteran who threw himself in front of his friends to shield them, an aspiring sports journalist who had survived a mall shooting just two months earlier, and a 6-year-old girl.
 The next step is an evaluation of Holmes by state doctors to determine whether he was insane at the time of the shootings. That could take months.



 Right: From thousands of observations, Cornell University scientists have determined geographic subpoints for the southern edges of auroral displays. The curves represent four values of the planetary index (Kp). As this index increases, the aurora's southern edge moves southward.