Ad

Showing posts with label earth. Show all posts

Thursday, November 12, 2015

UFO, Friday the 13th, Indian Ocean

It's interesting that conspiracy comes from just about anything these days.  Yes, there are UFO's, some of which are most definitely not of this world or are very mysterious.   However, the end?
Here's information regarding the UFO that is to crash into the Indian Ocean on Friday the 13th.  

"MYSTERY OBJECT TO HIT EARTH ON FRIDAY THE 13TH: A piece of space junk named "WT1190F" is going to hit Earth on Nov. 13th (0620UT). It will burn up in the atmosphere off the coast of Sri Lanka, with some debris possibly reaching the water's surface. According to the European Space Agency, "its mass is not sufficient to cause any threat to the area, but the show will still be spectacular, since for a few seconds the object will become quite bright in the noon sky." Astrophysicist Jonathan McDowell told Nature that "the object is only 1 to 2 metres in size, and its trajectory shows that it has a low density, and is perhaps hollow. That suggests an artificial object, 'a lost piece of space history that's come back to haunt us." At the moment, suspicions are focused on old Moon missions. For instance, it could be a spent rocket stage or lunar module from the Apollo program. Perhaps the impact itself will provide some clues. Stay tuned!"

UFO to crash into the Indian Ocean on November 13: Is it the end?

"Here is all you should definitely know about it:
  • The object is set to crash in the Indian Ocean, around 65 kilometres off the south of Sri Lanka
  • It is up to 7 feet long. According to the scientists, it could also be a piece of rocket from a recent lunar mission, or a part of an Apollo program spacecraft that has been into the space for over 40 years, or even a piece of Saturn V rocket which enabled man to walk on the moon, which was reported orbiting Earth in 2002
  • The contact of this object with the surface of the Earth will be a rare opportunity to observe its impact
  • The object was rediscovered by astronomers at the Catalina Sky Survey, earlier in October
  • Astronomers at the European Space Agency (ESA) are now monitoring the space junk's journey
  • The agency said that WT1190F 'poses very little risk to anyone'
  • Its collision will also help scientists improve the understanding of how space objects, man-made or natural, interacts with Earth's atmosphere
  • Researchers also say that the object's movement suggests that it is hollow inside."
INTERESTING>>>

"Despite claiming to see a UFO/drone, no concrete evidence was discovered to support the claims. Officers of the Intelligence Bureau, Bureau for Civil Aviation Security (BCAS), Delhi Police, and the Central Industrial Security Force (CISF) met to discuss the event and the IAF has been advised to keep strict vigil. It is interesting to note that the Delhi Police has prohibited the use of any laser beams or similar objects, by an individual or group, in and around the IGI airport. If eye-witness incidents are to be believed, this is a direct violation of the law. But the more important question is about the origins of these flying objects and laser beams. Some mysterious space junk, dubbed a UFO, is about to crash into the Indian Ocean on November 13, 2015. But the sightings at IGI were no ordinary space debris. It will be naive of us to dismiss this as an act of mischief. But to fuel theories regarding UFO sightings will only please the conspiracy camp, and upset the other lot."

Double Doubt The Following...
"The mystery metallic object is expected to crash into the sea on Friday, November 13, which is the third Friday 13 this year.
The high number of Friday 13s this year - there was one in 2014 and just one next year -  has sent some religious conspiracy theorists into overdrive.
They claim, while the impact may not lead to the end of the world itself, it could be a sign before the "Second Coming of Christ and Judgement Day."
Although astronomers have yet to identify the source of the mystery space debris, it is believed to have been part of something we once sent into space which has come back to haunt us."

Saturday, June 1, 2013

Interplanetary Shock Wave From Unknown Source Causing Strong Geomagnetic Storm

GEOMAGNETIC STORM: A G2-class (Kp=6) geomagnetic storm is in progress following the arrival of an interplanetary shock wave on May 31st. The source of the shock is not known; it might have been a minor CME that left the sun without drawing attention to itself. The impact sparked auroras across many northern-tier US states. This photo, for instance, comes from Christopher Griffith in Baxter, Minnesota:

"I wasn't expecting to see any lights, but right before the midnight it broke loose and the sky lit up," says Griffith. "Sadly the clouds quickly filled in my little window, and the auroras were gone. Just thankful for what I got so see!" Elsewhere in the USA, auroras were sighted as far south as ColoradoMarylandIowaWisconsin, andNebraska.
High-latitude sky watchers should remain alert for auroras tonight as Earth's magnetic field continues to reverberate from the impact. NOAA forecasters estimate a 40% chance of polar geomagnetic storms on June 1st.


Space Weather Message Code: ALTK06
Serial Number: 308
Issue Time: 2013 Jun 01 1502 UTC
ALERT: Geomagnetic K-index of 6
Threshold Reached: 2013 Jun 01 1500 UTC
Synoptic Period: 1500-1800 UTC
Active Warning: Yes
NOAA Scale: G2 - Moderate
Potential Impacts: Area of impact primarily poleward of 55 degrees Geomagnetic Latitude.
Induced Currents - Power grid fluctuations can occur. High-latitude power systems may experience voltage alarms.
Spacecraft - Satellite orientation irregularities may occur; increased drag on low Earth-orbit satellites is possible.
Radio - HF (high frequency) radio propagation can fade at higher latitudes.
Aurora - Aurora may be seen as low as New York to Wisconsin to Washington state.

Sunday, May 19, 2013

Solar Flare Propels Coronal Mass Ejection Towards Earth and Likely Will Cause Geomagnetic Storms Starting Today, May 19, 2013

CME IMPACT: A CME hit Earth's magnetic field on May 19th at 2250 UT (3:50 PM PDT). Polar geomagnetic storms and high-latitude auroras are possible in the hours ahead. Stay tuned for updates. 

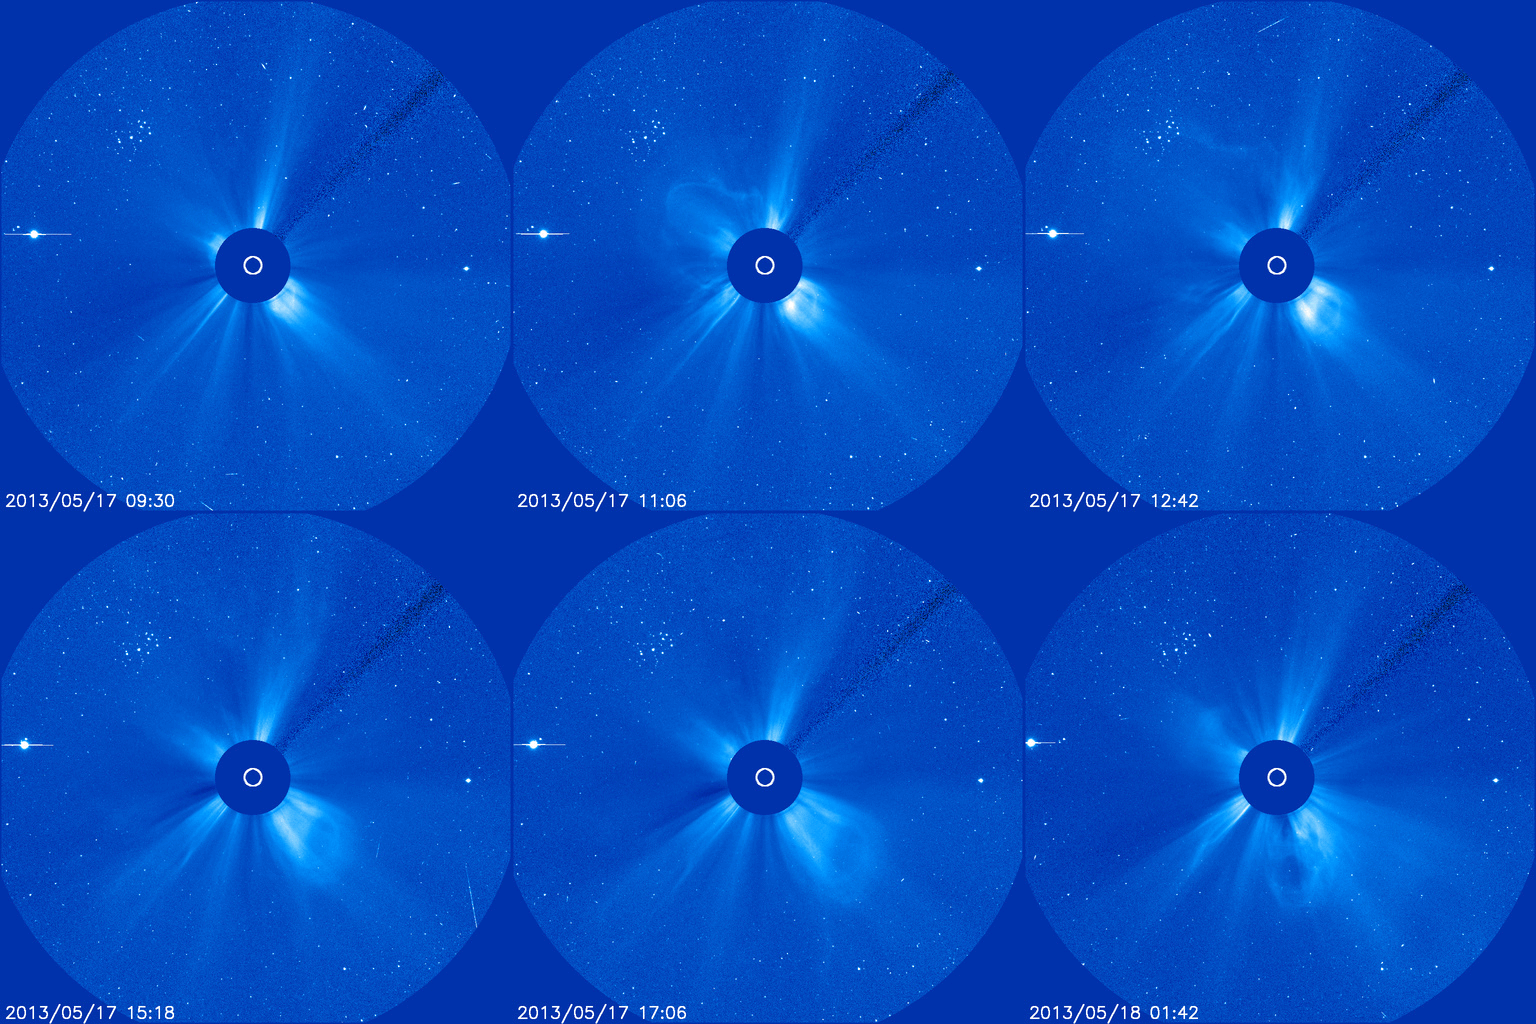
The CME was propelled toward Earth on May 17th by an M3-class solar flare in the magnetic canopy of sunspot AR1748. SOHO took this picture of the CME racing away from the sun at 1500 km/s (3.4 million mph):


It was hurled into space by an M3-class solar flare in the magnetic canopy of sunspot AR1748. In the video, the CME appears to hit Mercury, but it does not. It is merely passing in front of the innermost planet. The planet in the line of fire is Earth.

AURORAS INVADE THE USA: A CME hit Earth's magnetic field on May 18th at around 0100 UT. Although it was just a glancing blow, the impact was enough to spark a G1-class geomagnetic storm. In the United States, Northern Lights descended as far south as Pawnee Buttes, Colorado:


"The aurora was not visible to the naked eye," says photographer Robert Arn. "Only with a 30 second exposure did I know it was there. As I started to collect data, I noticed an electrical storm in the distance. The juxtaposition of the electrical storm and aurora made for a spectacular image. (The moon near the horizon illuminated the landscape.)"

Elsewhere in the United States, faint auroras were photographed in Michigan, Massachusetts, Washington, Vermont, and Iowa. Browse the aurora gallery for more sightings.


Planetary K-index
Now: Kp= 2 quiet
24-hr max: Kp= 4 
unsettled
explanation | more data
Interplanetary Mag. Field
Btotal13.8 nT
Bz3.3 nT south 
explanation | more data
Updated: Today at 2357 UT

SWPC ACE RTSW MAG 24-hour Updating Plot

3-day Estimated Planetary K-index graph


The K-index

The K-index is a code that is related to the maximum fluctuations of horizontal components observed on a magnetometer relative to a quiet day, during a three-hour interval. The conversion table from maximum fluctuation (nT) to K-index, varies from observatory to observatory in such a way that the historical rate of occurrence of certain levels of K are about the same at all observatories. In practice this means that observatories at higher geomagnetic latitude require higher levels of fluctuation for a given K-index. The conversion table for the Boulder magnetometer is shown below:
K
nT
0
0-5
1
5-10
2
10-20
3
20-40
4
40-70
5
70-120
6
120-200
7
200-330
8
330-500
9
>500
At SWPC, we monitor the preliminary values of the K-index, minute by minute, from a network of observatories that relay data in near-real time. The final K-indices are determined after the end of prescribed three hourly intervals (0000-0300, 0300-0600, ..., 2100-2400). The maximum positive and negative deviations during the 3-hour period are added together to determine the total maximum fluctuation. These maximum deviations may occur anytime during the 3-hour period.


Relationship between Kp and the Aurora [ref]
Right: From thousands of observations, Cornell University scientists have determined geographic subpoints for the southern edges of auroral displays. The curves represent four values of the planetary index (Kp). As this index increases, the aurora's southern edge moves southward

In this article we briefly explain some of the ideas behind the association of the aurora with geomagnetic activity and a bit about how the ‘K-index’ or ‘K-factor’ works. The aurora is understood to be caused by the interaction of high energy particles (usually electrons) with neutral atoms in the earth's upper atmosphere. These high energy particles can ‘excite’ (by collisions) valence electrons that are bound to the neutral atom. The ‘excited’ electron can then ‘de-excite’ and return back to its initial, lower energy state, but in the process it releases a photon (a light particle). The combined effect of many photons being released from many atoms results in the aurora display that you see.

The details of how high energy particles are generated during geomagnetic storms constitute an entire discipline of space science in its own right. The basic idea, however, is that the Earth’s magnetic field (let us say the ‘geomagnetic field’) is responding to a outwardly propagating disturbance from the Sun. As the geomagnetic field adjusts to this disturbance, various components of the Earth’s field change form, releasing magnetic energy and thereby accelerating charged particles to high energies. These particles, being charged, are forced to stream along the geomagnetic field lines. Some end up in the upper part of the earth’s neutral atmosphere and the auroral mechanism begins.

The disturbance of the geomagnetic field may also be measured by an instrument called a magnetometer. At our operations center we receive magnetometer data from dozens of observatories in one minute intervals. The data is received at or near to ‘real-time’ and allows us to keep track of the current state of the geomagnetic conditions. In order to reduce the amount of data that our customers have to deal with we convert the magnetometer data into three-hourly indices which give a quantitative, but less detailed measure of the level of geomagnetic activity. The K-index scale has a range from 0 to 9 and is directly related to the maximum amount of fluctuation (relative to a quiet day) in the geomagnetic field over a three-hour interval.

The K-index is therefore updated every three hours and the information is made available to our customers as soon as possible. The K-index is also necessarily tied to a specific geomagnetic observatory. For locations where there are no observatories, one can only estimate what the local K-index would be by looking at data from the nearest observatory, but this would be subject to some errors from time to time because geomagnetic activity is not always spatially homogenous. Another item of interest is that the location of the aurora usually changes geomagnetic latitude as the intensity of the geomagnetic storm changes. The location of the aurora often takes on an ‘oval-like’ shape and is appropriately called the auroral oval. A useful map of the approximate location of the auroral oval as a function of the Kp-index was published in the June 1968 copy Sky & Telescope (see page 348). The Kp index is derived through by an algorithm that essentially averages the K-indices from several stations. Note that as a storm becomes more intense, the edge of the auroral boundary typically moves to lower latitudes.

For further reading we can recommend a couple of books for you. An old, but classic text is The Polar Aurora, Oxford University Press, 1955, by Störmer. A more modern text is The Physics of Space Plasmas, 1991, by George Parks. If you are interested in real-time reporting of geomagnetic activity please make use of our 24-hour/day, 7 day/week services. We have an internet home page address (/), and a recorded message which is updated every three hours or as major activity occurs (303-497-3235). You can also reach us at 303-497-3204. We hope that you find this information helpful. If you have some further questions please don’t hesitate to let us know. Best wishes ! Chris Balch (cbalch@sec.noaa.gov)


SPACE WEATHER
NOAA Forecasts
Updated at: 2013 May 19 2200 UTC
FLARE
0-24 hr
24-48 hr
CLASS M
65 %
65 %
CLASS X
25 %
25 %
source: source: http://spaceweather.com/


3-day GOES X-ray Plot
The GOES X-ray Flux plot contains 5 minute averages of solar X-ray output in the 1-8 Angstrom (0.1-0.8 nm) and 0.5-4.0 Angstrom (0.05-0.4 nm) passbands. Data from the SWPC Primary and Secondary GOES X-ray satellites are shown. Some data dropouts from the Primary satellite will occur during satellite eclipses.
source: http://www.swpc.noaa.gov/rt_plots/xray_5m.html

SWPC ACE RTSW MAG & SWEPAM 24-hour Updating Plot

source: http://www.swpc.noaa.gov/ace/MAG_SWEPAM_24h.html


Geomagnetic Storms:
Probabilities for significant disturbances in Earth's magnetic field are given for three activity levels:activeminor stormsevere storm

Updated at: 2013 May 19 2200 UTC
Mid-latitudes
0-24 hr
24-48 hr
ACTIVE
35 %
15 %
MINOR
30 %
05 %
SEVERE
20 %
01 %
High latitudes
0-24 hr
24-48 hr
ACTIVE
05 %
15 %
MINOR
20 %
25 %
SEVERE
75 %
25 %


ACTIVE:

Geomagnetic Storm Forecasts
The geomagnetic storm probabilities are the estimated chances of at least one 3-hour K index, at the indicated level, for each of the next 3 days.

Active: K = 4.
Minor storm: K = 5.
Major or Severe storm: K > 6.

The "K index" is a 3-hourly quasi-logarithmic local index of geomagnetic activity relative to an assumed quiet-day curve for the recording site. Range is from 0 to 9. The K index measures the deviation of the most disturbed horizontal component of the magnetic field.
http://spaceweather.com/glossary/geostorm.html

MINOR:

Geomagnetic Storm Forecasts
The geomagnetic storm probabilities are the estimated chances of at least one 3-hour K index, at the indicated level, for each of the next 3 days.

Active: K = 4.
Minor storm: K = 5.
Major or Severe storm: K > 6.

The "K index" is a 3-hourly quasi-logarithmic local index of geomagnetic activity relative to an assumed quiet-day curve for the recording site. Range is from 0 to 9. The K index measures the deviation of the most disturbed horizontal component of the magnetic field.


http://spaceweather.com/glossary/geostorm.html

SEVERE:
Geomagnetic Storm Forecasts
The geomagnetic storm probabilities are the estimated chances of at least one 3-hour K index, at the indicated level, for each of the next 3 days.

Active: K = 4.
Minor storm: K = 5.
Major or Severe storm: K > 6.

The "K index" is a 3-hourly quasi-logarithmic local index of geomagnetic activity relative to an assumed quiet-day curve for the recording site. Range is from 0 to 9. The K index measures the deviation of the most disturbed horizontal component of the magnetic field.

http://spaceweather.com/glossary/geostorm.html


Friday, April 12, 2013

Aurora Alert! Strong Solar Flare.


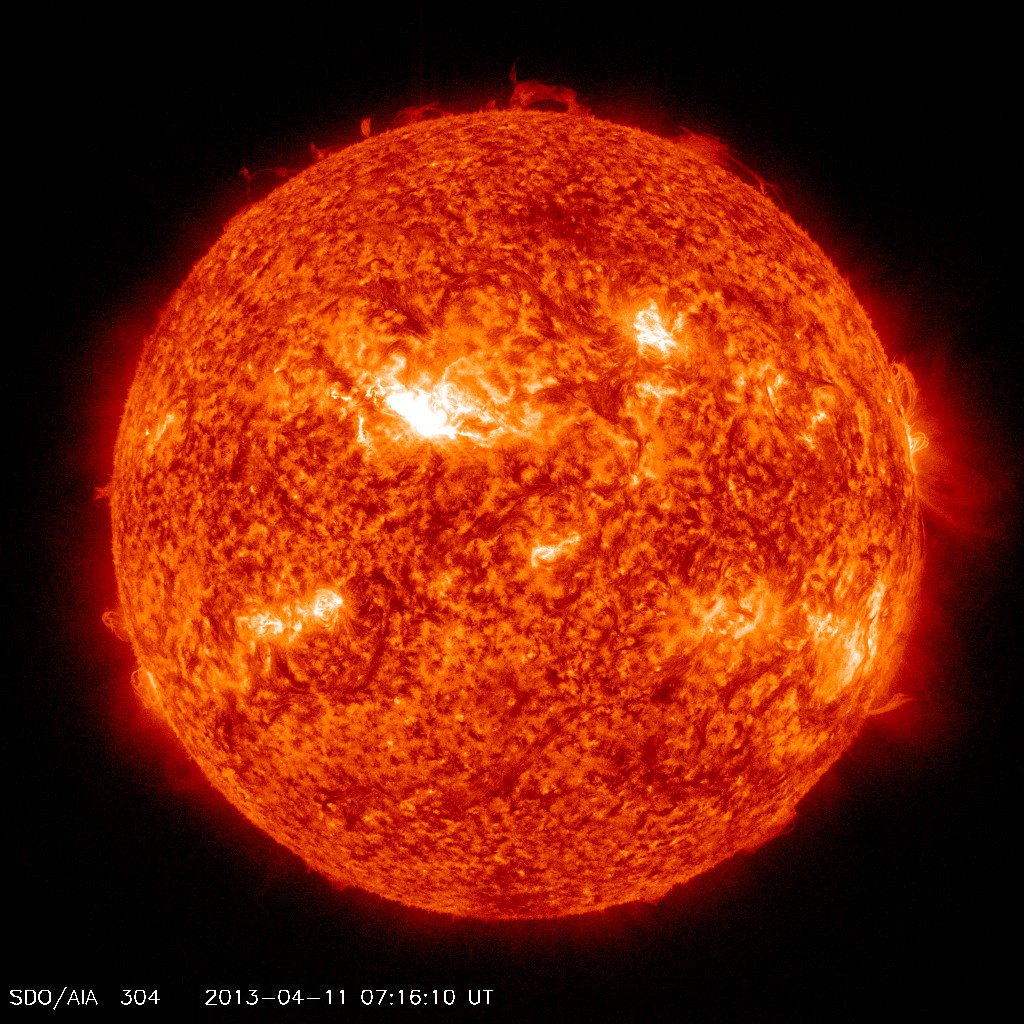
STRONG SOLAR FLARE: The magnetic field of sunspot AR1719 erupted on April 11th at 0716 UT, producing an M6-class solar flare. NASA's Solar Dynamics Observatory recorded the explosion's extreme ultraviolet flash:
Shortly after the flare, a CME emerged from the blast site. NOAA forecasters estimate a 60% chance of geomagnetic storms on April 13th when the cloud reaches Earth. High-latitude sky watchers, be alert for auroras!

Tuesday, March 26, 2013

More Mysterious Booms Without Explanation & Startling Residents


Spreading? Mysterious tremors rattle homes in South Jersey

March 21, 2013 – SOUTHERN NEW JERSEY - Just after 3 o’clock Tuesday afternoon residents in Atlantic, Cape May, and Cumberland counties say they felt multiple earthquake-like tremors that rattled their homes and offices. Absecon resident, Kay Stadlmeir, said, “I don’t think it would be an earthquake, but what could it be? It’s just really odd.” Somers Point resident, Bob Mower, explained, “There was a rattling of my windows and I felt the house shake just a little bit – it was unusual.” Stadlmeir told NBC40, “It has to be something really big to be witnessed in such a widespread area of South Jersey.” The reports vary from region to region. Atlantic county emergency management officials confirmed with the U.S. Geological Survey that it was not an earthquake. The next thought was that military training or an aircraft flying by might have caused the shakes. Both the 177th Fighter Wing in Egg Harbor Township and Joint Base McGuire-Dix-Lakehurst confirmed none of their aircrafts were in the area at that time. Joint Base McGuire-Dix-Lakehurst is still working to confirm whether or not any ground training was happening at the time, although it is unlikely that would cause such a widespread shake. Stadlmeir said, “I really don’t think it’s a sonic boom because, you know as I said before, I’ve experienced them before and this is nothing like that.” Mower told NBC40, “That was real unusual. I almost wondered if I was dreaming on that one.” After initial reports of the shakes came in, NBC40 put the word out on Facebook to see who else felt it. Immediately we received hundreds of responses from all over South Jersey. Concerned Egg Harbor Township resident, Oliana Collado, said, “I just think it’s weird because some people didn’t feel it and it’s like in random spots, and it’s very spread out. Yeah it was scary, but I’m just glad it wasn’t worse than what it was.” When we reached out to New Jersey State Police Headquarters, we were told that our call marked the first time they had heard about possible tremors and they were unable to tell us anything further. NBC40 will continue to investigate the cause of these mysterious tremors. –NBC40
contribution by Emanni
source: http://theextinctionprotocol.wordpress.com/2013/03/21/spreading-mysterious-tremors-rattle-homes-in-south-jersey/

Unexplained boom baffles experts, residents

NOISE HEARD IN SEVERAL COUNTIES MAY GO UNSOLVED
March 19, 2013 1:00 am  •  
The mystery of the “loud boom” heard in parts of the region over the weekend may go unsolved as efforts to find the source of the boom proved a bust Monday.
Hundreds of people in at least four counties — Franklin, Hamilton, Saline and Williamson — flocked to social media to report hearing a windows-rattling, earth-shaking boom between 1 and 2 p.m. Saturday.
No damages or injuries were reported as a result of the boom.
“I have no way of knowing exactly what occurred but it was not likely an earthquake,” geophysicist Don Blakeman of the National Earthquake Information Center said. “There is nothing on our lists, only the last one on the 11th (near Benton).”
Some earthquakes are heard as well as felt, he said, but if it was so widespread as to be heard in four counties, “We would be able to locate it as an earthquake,” he said. “Typically, when loud booms are heard it turns out to be a sonic boom, although I’m not saying that’s what it was in this instance.”
However, if the boom was sonic in nature, it wasn’t caused by military action. Neither Scott Air Force Base nor the North American Aerospace Defense Command reported activity taking place in the region Saturday.
“We were not in that area with any of our assets,” a NORAD spokesman said.
A Scott Air Force spokeswoman confirmed no Scott or military-related activities or exercises took place in Southern Illinois over the weekend.
The boom was not weather-related, according to meteorologist Robin Smith of the National Weather Service in Paducah said.
Nor was it related to any coal mining activity, a spokeswoman for the Illinois Office of Mines and Minerals said.
The swarm of social media postings caused Franklin County Emergency Management Agency Director Ryan Buckingham to make his own post on the agency’s Facebook page.
“Residents in Franklin County are reporting what was described as a ‘ground-shaking loud boom’ during the day on Saturday 3/16/2013. USGS (U.S. Geological Survey) has not reported any earthquake activity in our area during that time, leaving the cause of these reports as somewhat of a mystery,” Buckingham wrote.
The mystery was not cleared up by Monday, he said.
“We picked it up first on social media. A lot of people heard it but didn’t have a source for it,” Buckingham said. “I put a feeler out on Facebook because if there is a threat to public safety, that’s something we need to know about it, but no one had any idea what caused it.”
While the source of the boom has yet to be traced, Buckingham said it should serve as a reminder for residents to have a plan in place in case of emergency.

Thursday, March 21, 2013

Does Uptick in Mysterious "Booms" Foretell Mega-Quake?

Brandon Turbeville
Activist Post

Back in October, I wrote an article entitled “Numerous Reports of Mysterious Booms and Strange Lights Over South Carolina,” in which I described the sounds and vibrations heard and felt all across the Pee Dee region of South Carolina with some witnesses even describing strange lights in the sky at the time of the event.

These strange occurrences were eerily similar to those described by individuals all across the state of Michigan like Bob Powell of The Truth Is Viral, who was actually detained as a result of attempting to investigate the nature of these sounds and vibrations. Please see my article, “Investigation Continues Into Source of Strange Michigan Area ‘Explosions’ and Radiation Spikes” for a further description of what took place in Michigan.

Similar noises and vibrations were also felt in New Jersey around October, as I wrote in my article “New Mysterious 'Booms' Reported in New Jersey.”

But while the incidents in Michigan and New Jersey were researched from a distance, it just so happens that this writer was in the Pee Dee region of South Carolina when the two “mysterious booms” in the first article took place. At the time, I described the incidents as follows:

[The incidents] spann[ed] the entire Pee Dee region and all the way into North Carolina. On the evening of November 5, around 7:30-7:45 p.m., various law enforcement and local news agencies were contacted by individuals living in the Pee Dee region of South Carolina in reference to a loud “boom” that was large enough to shake their houses.


The reports were numerous around Pamplico, Johnsonville, Marion, Hemingway, Aynor, Nichols, Hannah, and Mullins. However, as stated earlier, reports also came from as far away as Evergreen, North Carolina.

Marion County dispatchers alone received more than 100 calls in ten minutes related to the “booms.”


The US Geological Society has publicly stated that there was no seismic activity in the region on these dates and emergency dispatchers confirmed that there had been no plane crash.


Very soon after the event, Johnsonville Police Chief, Ron Douglas, claimed the “booms” were “from a handful of military aircraft” that had broken the speed of sound.
However, this explanation, which was rapidly adopted by the local media, does not hold water. For one thing, most of the individuals I have spoken to (as well as myself) have heard jets break the sound barrier before and both the sound and the impact of the mysterious “booms” were much different than that of jets breaking the sound barrier.


Secondly, if the jets were the cause of the sound and of the heavy vibrational impact that shook so many houses, the jets themselves would have had to be flying very low. But, if the jets were flying low enough for this type of effect to be achieved, witnesses would have also been able to hear the jets.


This writer can personally attest to the intensity of the “booms” as I, myself, was in the area at the time of the incident. The sound, much like what Bob Powell described sounded much more like artillery than any other comparable sound. There was no lead up to the shaking, it was simply as if one was experiencing the vibrations of an explosion.


The impact was so strong that one way to describe hearing and feeling the impact from inside the house, it would be if one could imagine a full grown adult climbing on top of the back of a couch or recliner and leaping off, landing full force on the living room floor. Much like this scenario, the impact was sudden and short-lived.
The sound, however, was extremely similar to the firing of artillery, much as Powell described it in Michigan.

The above incident occurred, as mentioned earlier, on November 5. However, one week prior, a similar, albeit weaker, explosion was heard in the same locations. Reports were made to this writer from both Marion and Mullins in terms of the noticeable impacts and sounds of this separate explosion. Like the first, the sound was similar to artillery, the impact was also distinct but sudden and brief.


To my knowledge, there have been no mainstream local reports of the earlier “explosion.” Also as in the second incident, I can personally attest to the nature of the first. 
 
After the initial curiosity surrounding the incidents subsided, news coverage and local talk expectedly subsided as well. Yet, on January 6, 2013, South Carolina residents again began hearing these booms and feeling the vibrations powerful enough to “rattle windows.” This time, the location was not the Pee Dee region but in the Red Bank area of Lexington County. Interestingly enough, around the same time period (between January 2- 6 2013), these “booms” were heard and felt in other locations across the country including in Alaska, Oklahoma, Massachusetts, and Indiana.

The Pee Dee region was not to be overlooked, however, as on March 2, 2013, more reports were published regarding booms and vibrations powerful enough to shake houses. As with the other instances of booms and vibrations, there was no seismological activity in the area at the time. [1]
However, since the first set of occurrences in the Pee Dee region, two individuals have been paying special notice to the incidents of the mysterious booms, detailing and recording the dates of their occurrence as felt in the Conway/Myrtle Beach area.

read more at http://www.activistpost.com

Friday, January 11, 2013

Earth Directed Solar Flares. Asteroid DA14...Watch Out. Solar Maximum.


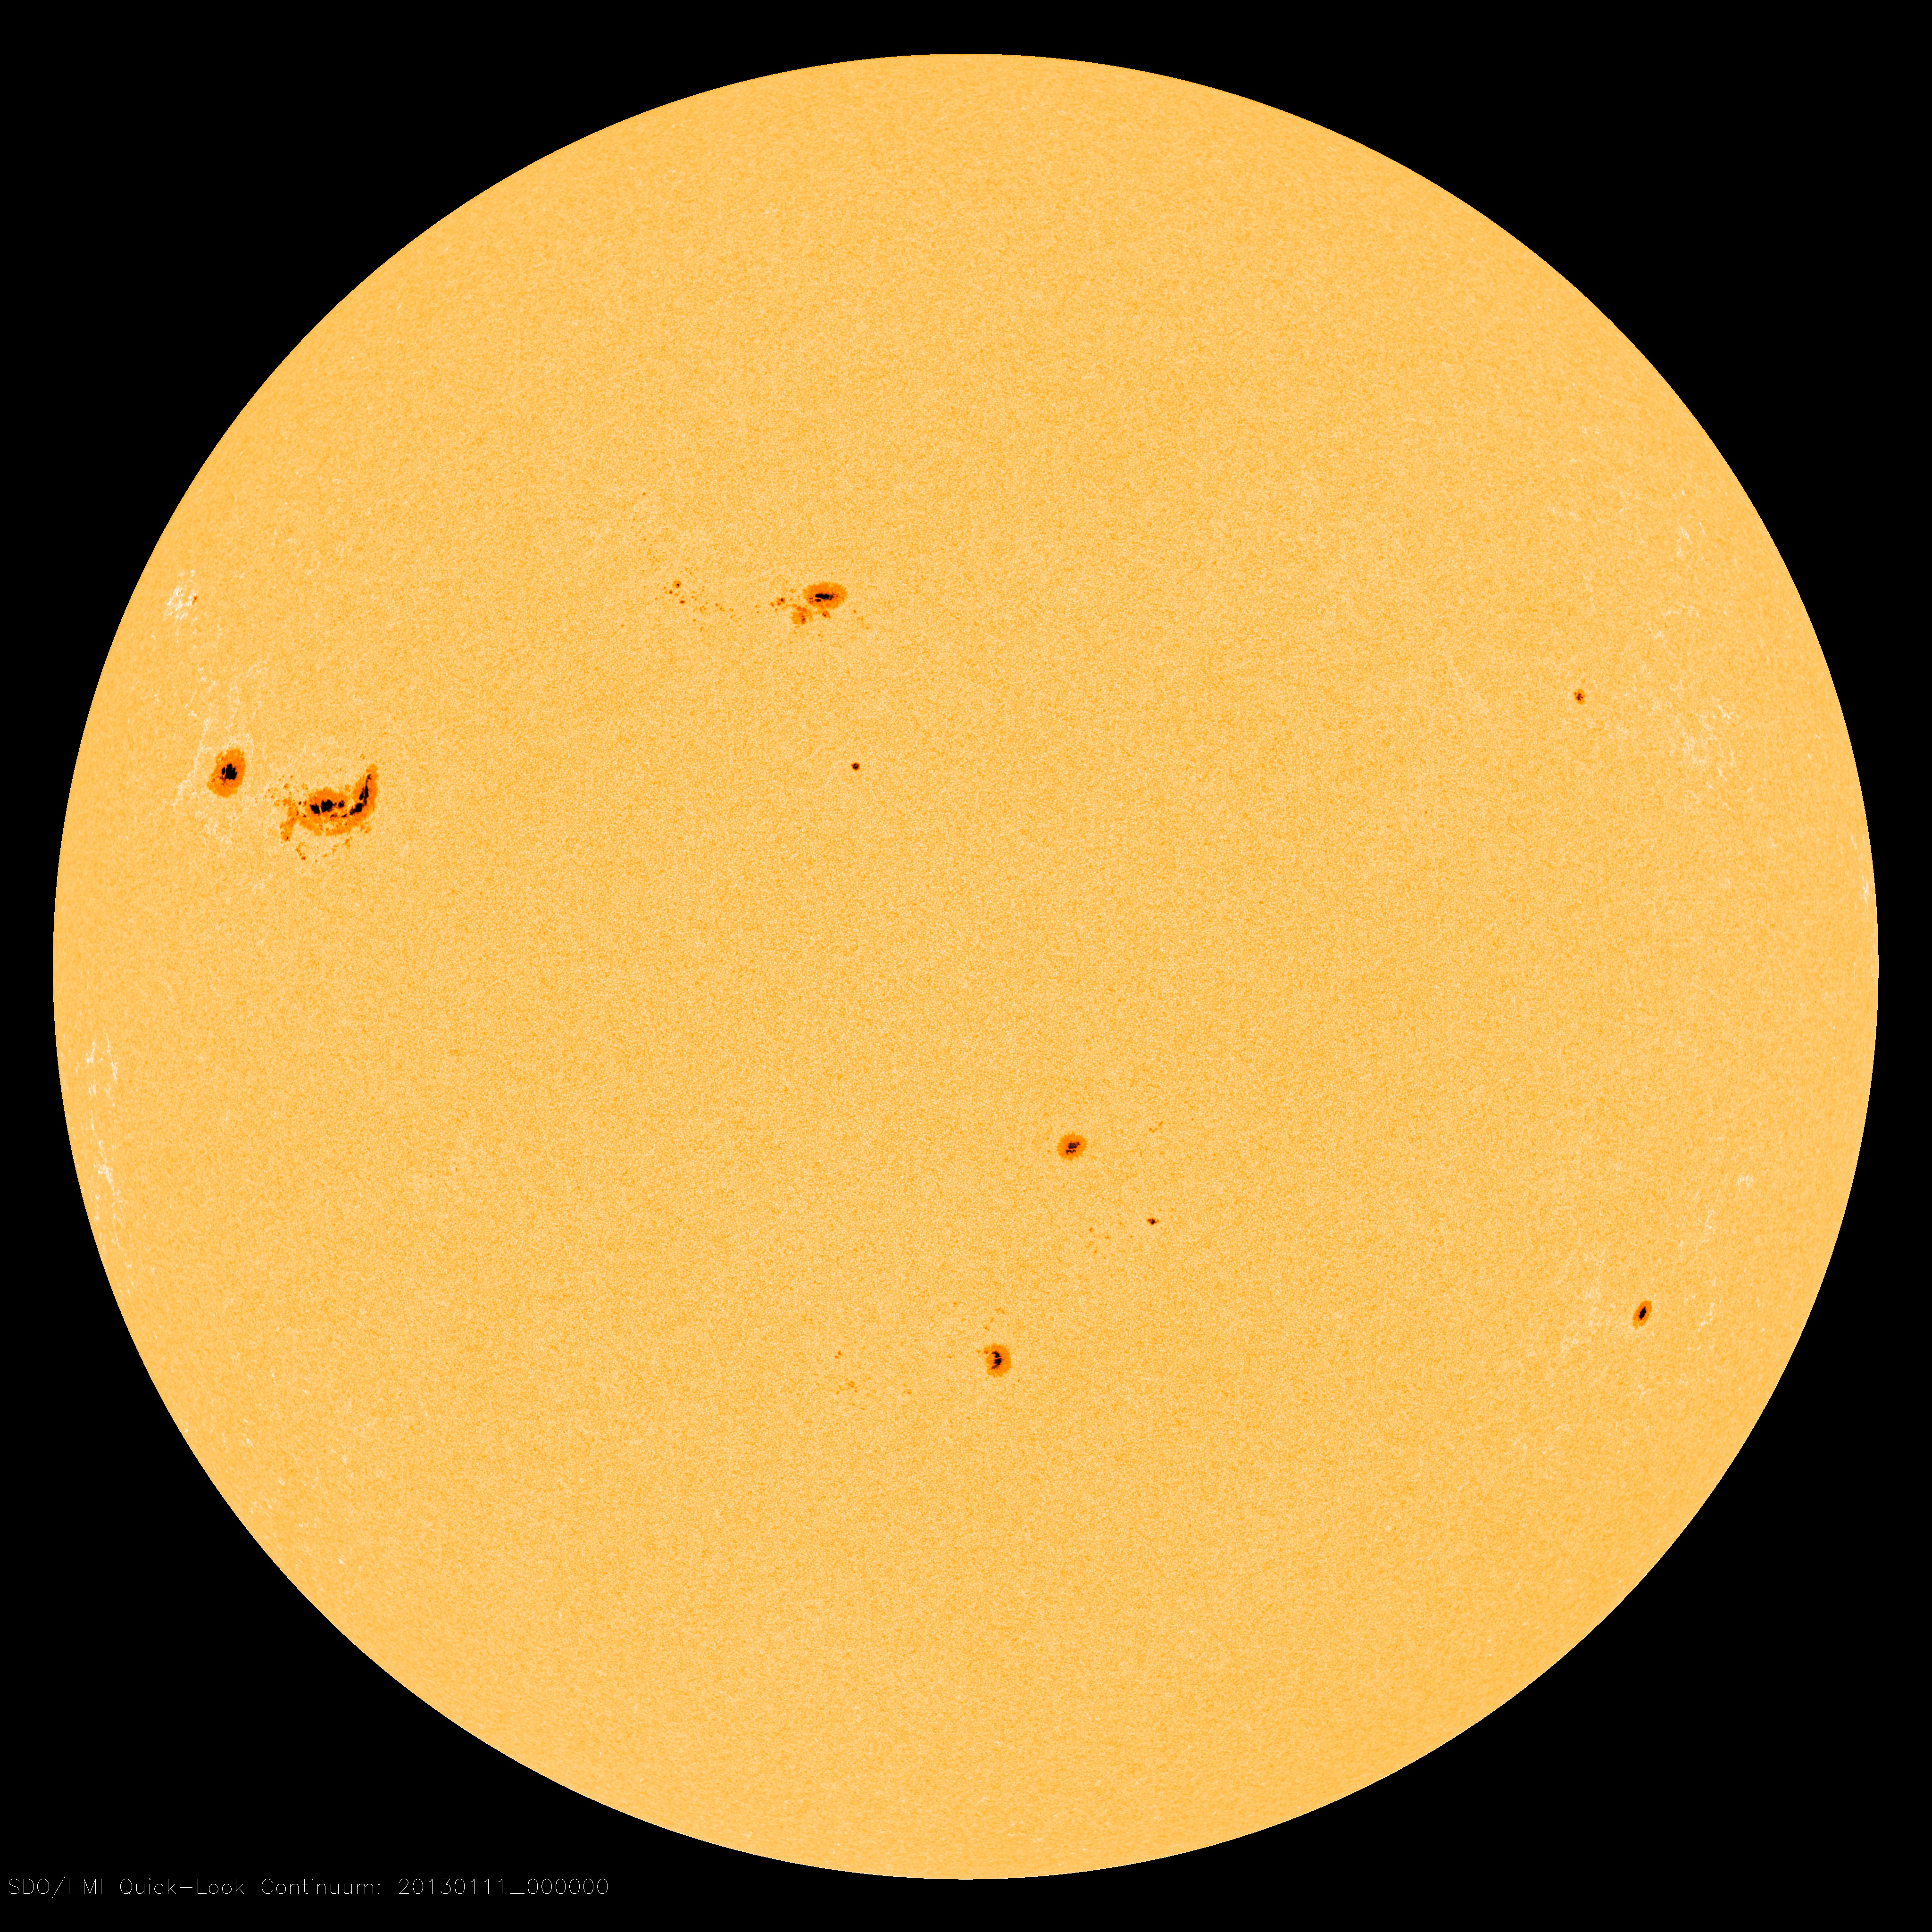
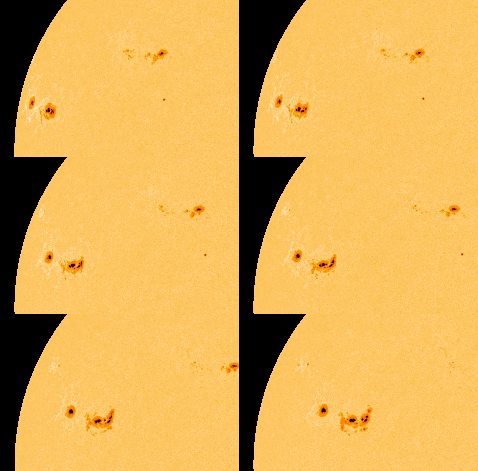
INCREASING CHANCE OF FLARES: Big sunspot AR1654 is growing more active. It is now crackling with M-class solar flares, such as this one recorded by NASA's Solar Dynamics Observatory this morning at 09:11 UT:


AR1654 is getting bigger as it turns toward Earth: movie. Not only is the chance of flares increasing, but also the chance of an Earth-directed eruption.This could be the sunspot that breaks the recent lengthy spell of calm space weather around our planet

X-ray Solar Flares
6-hr max: M1 
1508 UT Jan11 
24-hr: M1 
0911 UT Jan11 
explanation | more dataUpdated: Today at: 2000 UT


Daily Sun: 11 Jan 13

Sunspots AR1652 and AR1654 have beta-gamma magnetic fields that harbor energy for M-class solar flares. Credit: SDO/HMI

SPACE WEATHERNOAA Forecasts
Updated at: 2013 Jan 10 2200 UTC
FLARE
0-24 hr
24-48 hr
CLASS M
50 %
50 %
CLASS X
05 %
05 %

Asteroid 2012 DA14 to sweep close on February 15, 2013

It’ll pass within the moon’s distance from Earth – closer than the orbits of geosynchronous satellites. But it won’t strike us in 2013.

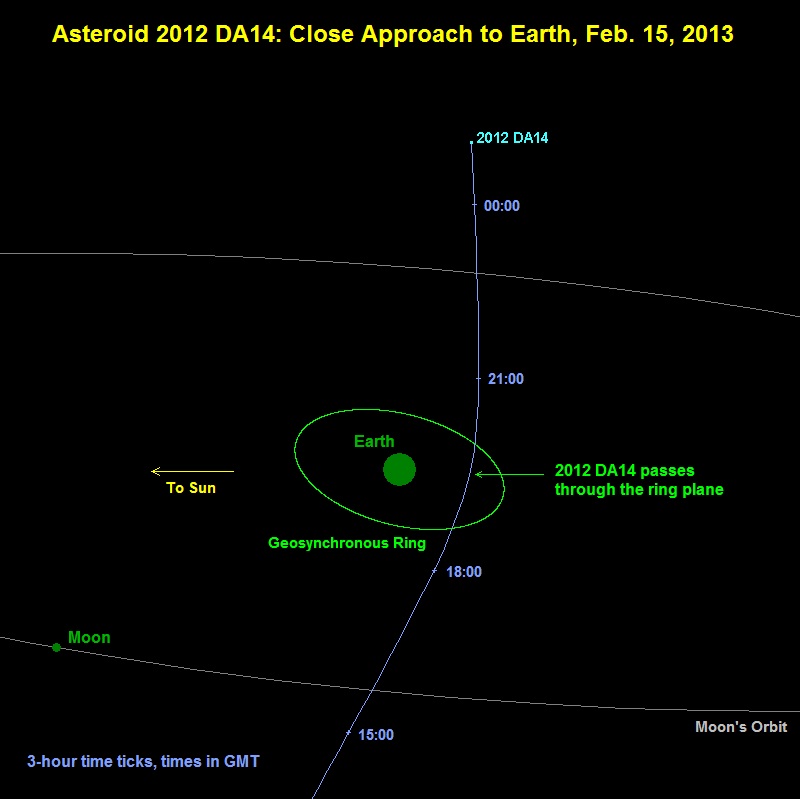
A near-Earth asteroid – called 2012 DA14 by astronomers – will pass very close to Earth on February 15, 2013. Astronomers estimate that, when it’s closest to us, it’ll be within the orbit of the moon (which is about 240,000 miles away), and within the orbits of geosynchronous satellites (about 26,000 miles up). 2012 DA14 will be about 21,000 miles (35,000 kilometers) away. It will not strike Earth in 2013. Astronomers’ calculations of asteroid orbits can be trusted. After all, even decades ago, they knew enough about calculating orbits to send people to the moon and bring them safely back, and today we are able place our space vehicles in orbit around objects as small as asteroids.
So, no, 2012 DA14 won’t strike us in 2013. There was a remote possibility it might strike us in 2020, but that possibility has been ruled out also.

Asteroid 2012 DA14 will pass closest on February 15, 2013. As the image above shows, it will pass much closer than the orbit of the moon - closer even that orbiting geosynchronous satellites (22,000 miles). View larger. Image Credit: NASA
What will happen when Asteroid 2012 DA14 passes closely in 2013?
What will happen when it passes us? The short answer is … nothing. On the day it passes, most of us won’t see it or be aware of its passage, in any way. The asteroid won’t alter the tides. It won’t cause volcanoes. It’ll just sweep closely past us – as millions of asteroids have done throughout Earth’s four-and-a-half-billion-year history – some in your own lifetime.
The asteroid will be within range for small telescopes and solidly mounted binoculars, used by experienced observers who have access to appropriate stars charts. Here’s what NASA says about its visibility:
On [February 15, 2013], the asteroid will travel rapidly from the southern evening sky into the northern morning sky with its closest Earth approach occurring about 19:26 UTC when it will achieve a magnitude of less than seven, which is somewhat fainter than naked eye visibility. About 4 minutes after its Earth close approach, there is a good chance it will pass into the Earth’s shadow for about 18 minutes or so before reappearing from the eclipse. When traveling rapidly into the northern morning sky, 2012 DA14 will quickly fade in brightness.
What do we know about asteroid 2012 DA14?
Asteroid 2012 DA14 is a little guy, compared to some asteroids, although its size has not been pinned down precisely. It is thought to be about 45 meters across (nearly 150 feet across), with an estimated mass of about 130,000 metric tons.
If a space object 150 feet wide were to strike our planet, it wouldn’t be Earth-destroying. But it has been estimated that it would produce the equivalent of 2.4 megatons of TNT. How does that compare with other known impact events on Earth? In 1908, in a remote part of Russia, an explosion killed reindeer and flattened trees. But no crater was ever found. Scientists now believe a small comet struck Earth. That event has been estimated at 3 to 20 megatons. So 2012 DA14 is in the same approximate realm as the Tunguska comet (which, actually, might have been an asteroid instead). It would not destroy Earth, but it could flatten a city.
Of course, about 70% of our world is covered by oceans. That means the most likely landing spot of any incoming asteroid is in the water – not on a city or other populated area.
Astronomers at the Observatorio Astronómico de La Sagra in Spain discovered 2012 DA14 in early 2012. We know 2012 DA14′s orbit is similar to that of Earth. That is one reason the asteroid eluded astronomers until recently. You can be sure that many astronomers are carefully tracking 2012 DA14 now.
The orbit of 2012 DA14 is an inclined ellipse. In other words, it’s tilted sightly with respect to Earth’s orbit around the sun, and, like Earth’s orbit, it’s not circular but elliptical – like a circle that someone sat down on. According to Bad Astronomer Phil Plait, who appears to have used a computer program to look at its orbit:
The asteroid spends most of its time well away from our planet. However, the path of the rock does bring it somewhat close to the Earth twice per orbit, or about every six months. The last time it passed us was on February 16 [2012], when it was about 2.5 million km (1.5 million miles) away, equal to about 6 times the distance to the moon. That’s usually about the scale of these encounters — it misses us by quite a margin.
If we know it will miss us in 2013 and in 2020, why are astronomers still watching? In fact, the orbit of 2012 DA14 is not entirely pinned down, although it is known well enough to say for sure: it will not hit us next year, or in 2020.
But it will come close on February 15, 2013! It should be close enough to catch the attention of virtually everyone on Earth in February 2013, on what’s sure to be a media field day.
Will 2012 DA14 strike Earth in 2020?
No. In March 2012, when a collision between 2012 DA14 and Earth in 2020 was still remotely possible, I asked astronomer Donald Yeomans to clarify the risk. Yeomans is, among other things, manager of NASA’s Near-Earth Object Program Office at NASA’s Jet Propulsion Laboratory. In March 2012, he told EarthSky that a 2020 collision between Earth and asteroid 2012 DA14 was …
… approximately one chance in 83,000, with additional remote possibilities beyond 2020. However, by far the most likely scenario is that additional observations, especially in 2013, will allow a dramatic reduction in the orbit uncertainties and the complete elimination of the 2020 impact possibility.
It turned out they didn’t have to wait until 2013. By May, 2012, astronomers had ruled out even the remote possibility of a 2020 collision.
Still, 2012 DA14 and asteroids like it are sobering.
Bottom line: The near Earth asteroid 2012 DA14 will have a very close pass near Earth on February 15, 2013. It will sweep approximately 21,000 miles from us – much closer than the moon’s orbit and closer than geosynchronous satellites. It will not strike Earth. Its orbit around the sun can bring it no closer to the Earth’s surface on February 15, 2013 than 3.2 Earth radii.


Solar Variability and Terrestrial Climate

The March Towards Max

The March Towards Max
These six images from SDO, chosen to show a representative image about every six months, track the rising level of solar activity since the mission first began to produce consistent images in May, 2010. The period of solar maximum is expected in 2013. The images were taken in the 171 Angstrom wavelength of extreme ultraviolet light.

Sun-Climate (tsi, strip)
Space-borne measurements of the total solar irradiance (TSI) show ~0.1 percent variations with solar activity on 11-year and shorter timescales. These data have been corrected for calibration offsets between the various instruments used to measure TSI. SOURCE: Courtesy of Greg Kopp, University of Colorado.


Sun-Climate (pacific anomaly, strip)
Composite averages for December-January-February for peak solar years. SOURCE: G.A. Meehl, J.M. Arblaster, K. Matthes, F. Sassi, and H. van Loon, Amplifying the Pacific climate system response to a small 11 year solar cycle forcing, Science 325:1114-1118, 2009; reprinted with permission from AAAS.


Sun-Climate (sunspot numbers, strip)
The yearly averaged sunspot number for a period of 400 years (1610-2010). SOURCE: Courtesy of NASA Marshall Space Flight Center.