Published June 8, 2011
A mushroom of cooled plasma popped like a pimple and rained onto the surface of the sun yesterday—shooting perhaps the largest amount of solar material into space ever seen, scientists say.
The solar flare—an unusually bright spot on the sun—wasn't surprising as a "moderate" event. Space observatories in the past year recorded about 70 such solar flares, each roughly ten times weaker than "extreme" flares, of which only two have occurred since 2007.

Instead, what shocked scientists was the unusual amount of material that lofted up, expanded, and fell back down over roughly half the surface area of the sun. The event's simultaneous launch of particles into space is called a coronal mass ejection (CME).
"This totally caught us by surprise. There wasn't much going on with this spot, but as it came from behind the sun, all of the sudden there was a flare and huge ejection of particles," said astrophysicist
Phillip Chamberlin of NASA's Solar Dynamics Observatory (SDO), one of several spacecraft that recorded the event.
"We've never seen a CME this enormous."
Solar Flares May Threaten Power Grids
Chamberlin said it will take some time to calculate the energy and mass of electrons and protons blasted into space. But he noted the volume occupied a space hundreds of times bigger than a single Earth.
The ejection of particles burst from the right limb of the sun and sprayed into space, so the blast will miss Earth—though the explosion may brighten auroras near Earth's poles, Chamberlin said.
But he warned space-weather experts are concerned about future solar events.
The sun's 11-year cycle of activity, driven by tangled surface magnetic fields, will hit its maximum in late 2013 or early 2014. Magnetic messiness will peak around that time and prompt nasty solar storms.
"We'll probably see [extreme] flares every couple of months instead of years," Chamberlin said.
If one of these powerful flares—and its coronal mass ejection—faces Earth, the particles will pound satellite components with charged particles, short some out, and potentially cripple them.
On the planet's surface, extra currents of solar particles drive extra electric current through power lines and heat them up. A
solar storm in 1859, for example, caused telegraph lines to burst into flames. Power companies distribute loads to avoid such a disaster, but energetic solar storms could still blow transformers and lead to power outages, especially during heat waves like the one sweeping the eastern U.S. this week.
"Despite great countermeasures, the power grid is still vulnerable. We could be in for some serious problems," Chamberlin said.
http://news.nationalgeographic.com/news/2011/06/110608-solar-flare-sun-science-space/
***********************end update*********************************
Update: 8-3-2011
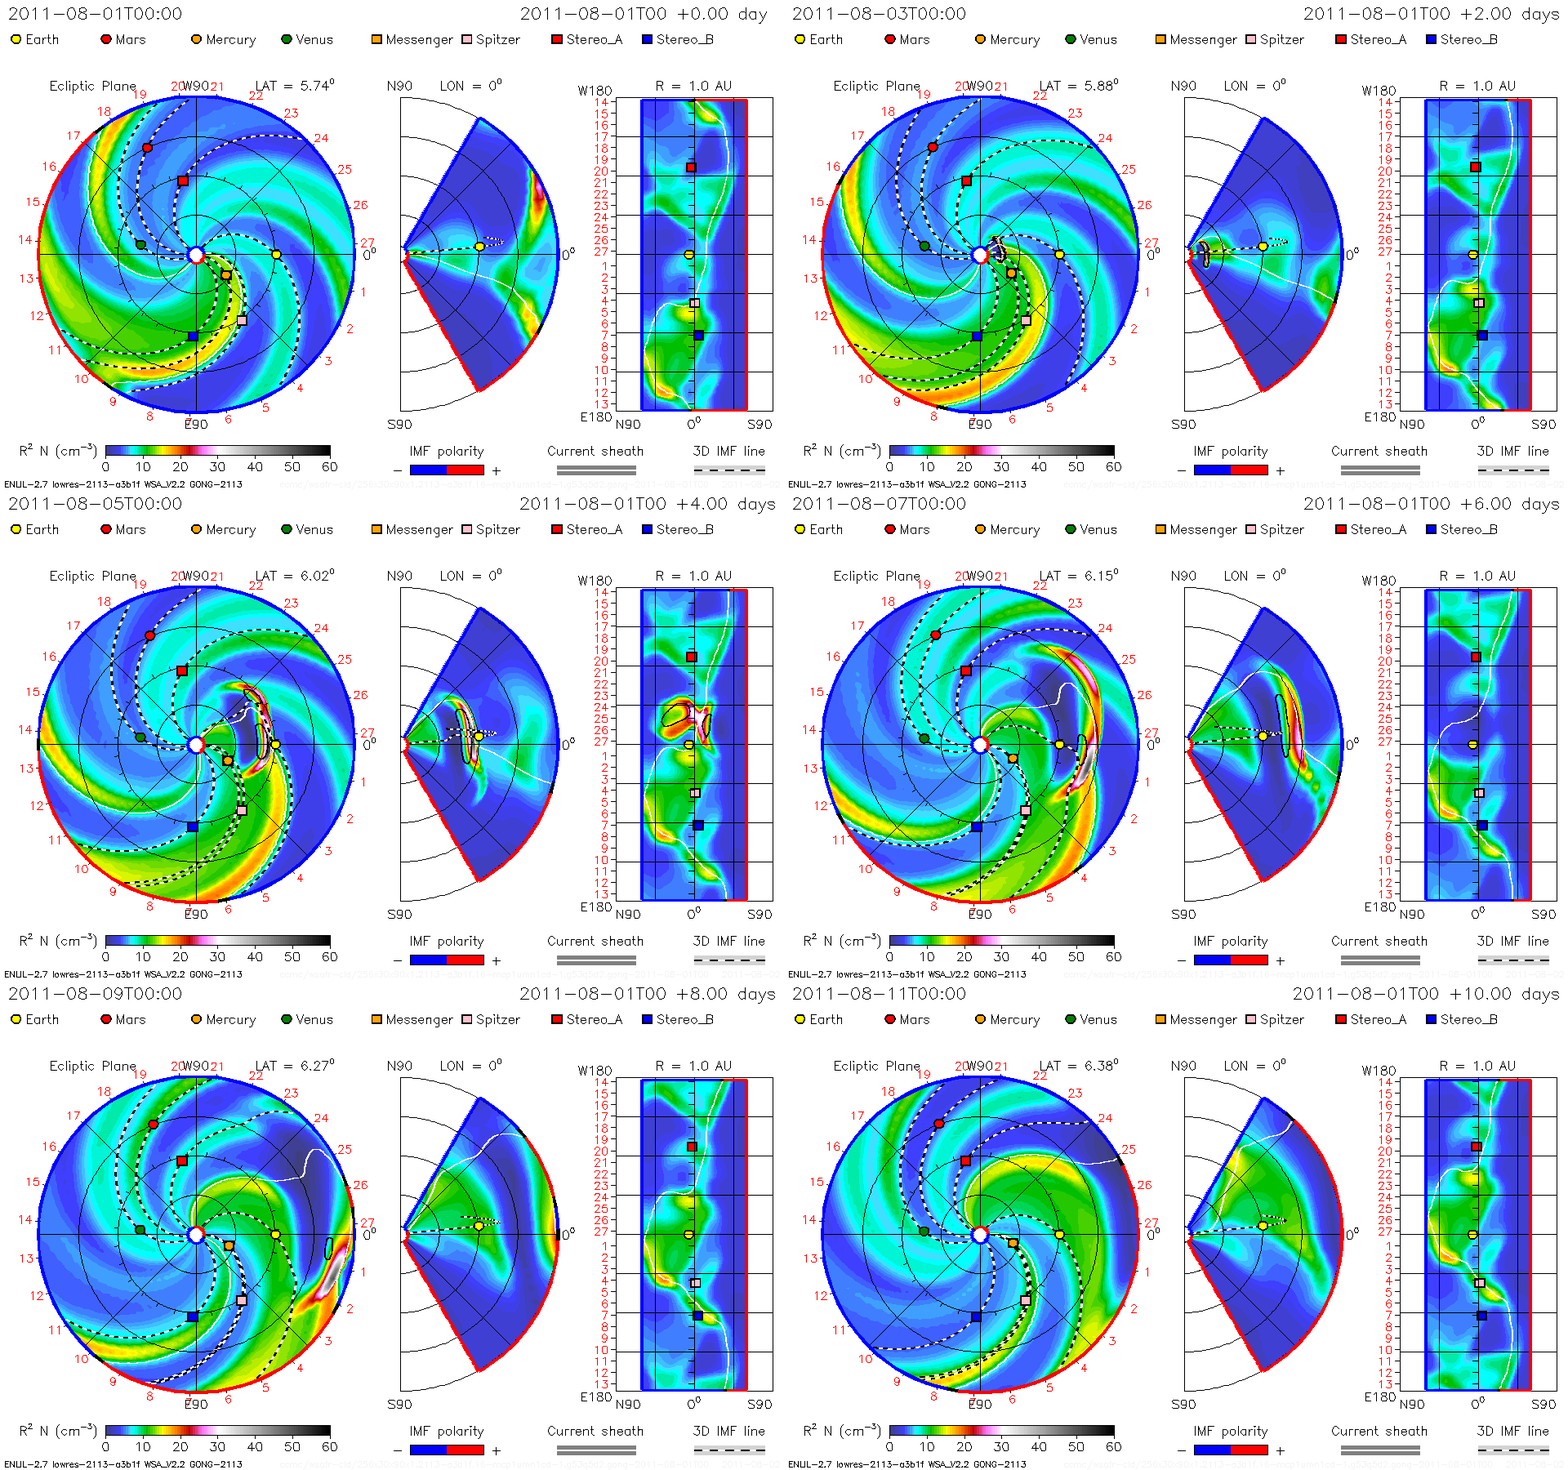
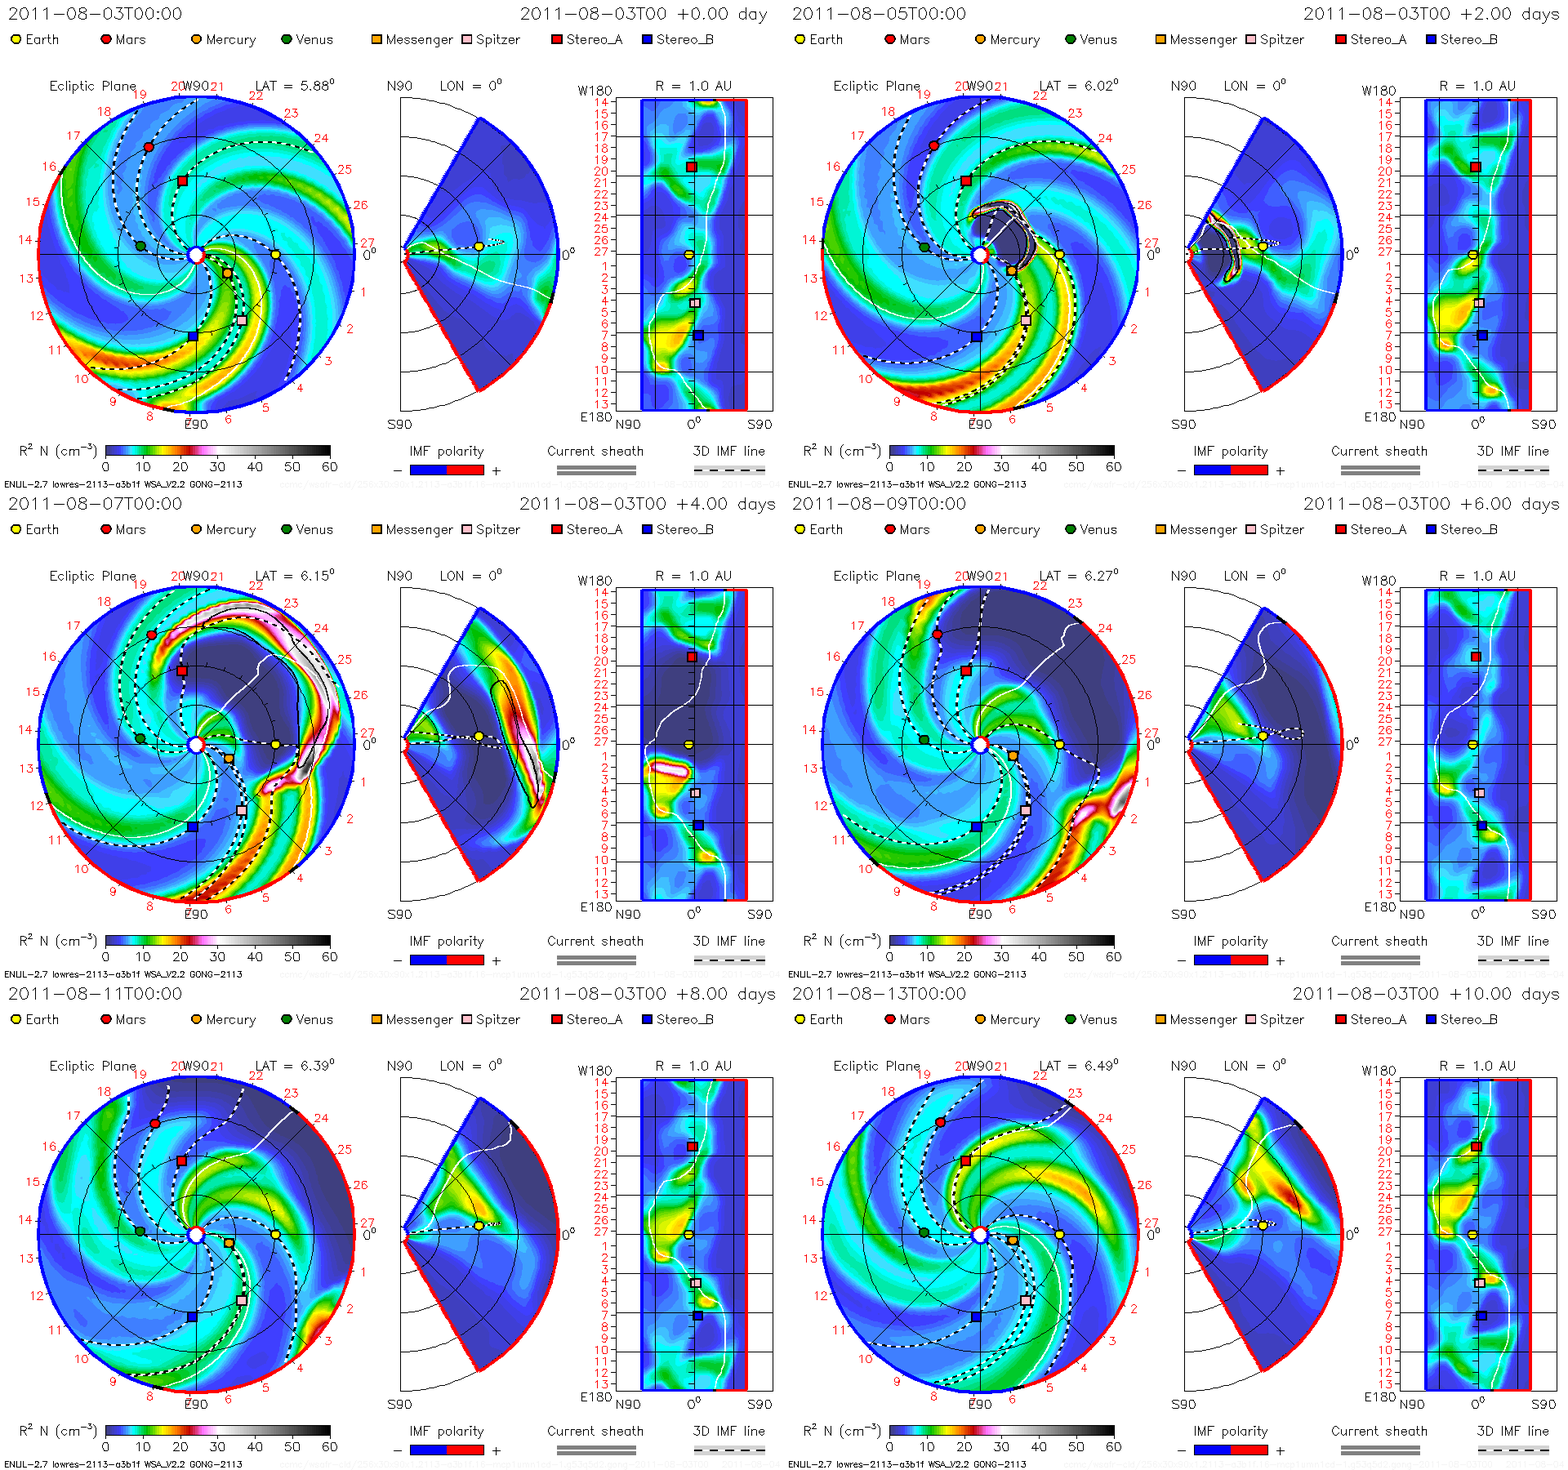
INCOMING CLOUD: Yesterday's M1-class eruption from sunspot 1261 was observed by three spacecraft: SOHO, STEREO-A and STEREO-B. Using data from those three points of view, analysts at the GSFC Space Weather Lab have made a 3-dimensional model of the CME now en route to Earth. Click on the image to launch a computer-generated movie of the expanding cloud:
According to their work, the CME left the sun traveling 900 km/s and should reach Earth (denoted by a yellow dot in the simulation) on August 5th at 0300 UT plus or minus 7 hours. Another cloud produced by today's M-flare may be right behind it; stay tuned for movies of that one, too. Mild to moderate geomagnetic storms are possible when these CMEs arrive on August 5th and 6th.
http://spaceweather.com/
**********END UPDATE******************
SOLAR ALERT 8-2-2011
EARTH-DIRECTED BLAST: Magnetic fields above sunspot 1261 erupted this morning at 0648 UT, producing a long-duration M1-class solar flare. At the peak of the action, NASA's Solar Dynamics Observatory recorded a surge of extreme ultraviolet radiation around the sunspot:
The blast also hurled a bright coronal mass ejection (CME) toward Earth. This movie from NASA's STEREO-Ahead spacecraft shows the cloud racing away from the sun at almost 900 km/s. Geomagnetic storms are possible when the CME arrives on or about August 5th.
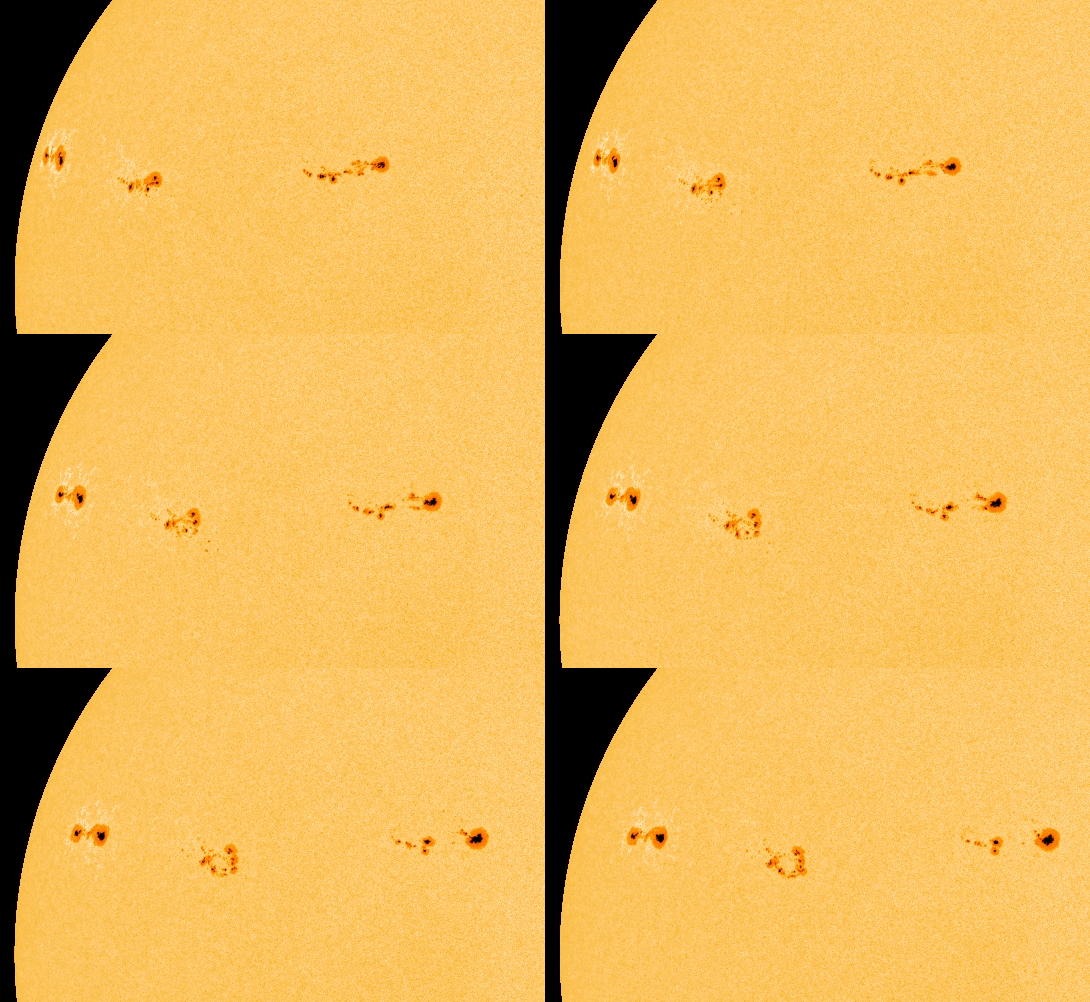
MAGNIFICENT SUNSPOT: Double sunspot 1263 is a whopper. Its two dark cores are each wider than Earth, and the entire region stretches more than 65,000 km from end to end. Yesterday in the Netherlands, Emil Kraaikamp took advantage of a break in the clouds and "a few moments of steady air" to capture this magnificent photo:
"To image this monster, I used a 10-inch Newtonian telescope capped by a white light solar filter," says Kraaikamp. He used the same setup to photograph nearby sunspot 1261. The clarity of both images is impressive. Note the granulation of the stellar surface surrounding the main dark cores. Those are Texas-sized bubbles of plasma rising and falling like water boiling on top of a hot stove.
The magnetic field of sunspot 1263 harbors energy for powerful X-class solar flares. Because the sunspot is turning to face Earth, any such eruptions in the days ahead would likely be geo-effective.
Solar Terrestrial Activity Report

Last major update issued on August 2, 2011 at 05:50 UTC. Minor update posted at 07:45 UTC.
http://www.solen.info/solar/
| SPACE WEATHERNOAA Forecasts | |
Updated at: 2011 Aug 01 2200 UTC
FLARE | 0-24 hr | 24-48 hr |
CLASS M | 60 % | 60 % |
CLASS X | 10 % | 10 % |
 Geomagnetic Storms:Probabilities for significant disturbances in Earth's magnetic field are given for three activity levels:active, minor storm, severe storm
Updated at: 2011 Aug 01 2200 UTC
Mid-latitudes
Geomagnetic Storms:Probabilities for significant disturbances in Earth's magnetic field are given for three activity levels:active, minor storm, severe storm
Updated at: 2011 Aug 01 2200 UTC
Mid-latitudes
| 0-24 hr | 24-48 hr |
ACTIVE | 05 % | 05 % |
MINOR | 05 % | 01 % |
SEVERE | 01 % | 01 % |
High latitudes
| 0-24 hr | 24-48 hr |
ACTIVE | 15 % | 05 % |
MINOR | 05 % | 01 % |
SEVERE | 01 % | 01 %
|
|
*************************end update************************************************
UPDATE 7-30-2011*******************
GEOMAGNETIC STORM WARNING: High-latitude sky watchers should be alert for auroras. A polar geomagnetic storm (magnitude Kp=5) is underway in response to solar wind buffeting Earth's magnetic field.
STRONG FLARE: Sunspot AR1261 unleashed a brief but strong M9-class solar flare on July 30th at 0209 UT. NASA's Solar Dynamics Observatory recorded the flare's extreme ultraviolet flash:
Because of its brevity, the eruption did not hurl a substantial cloud of material toward Earth. No CME is visible in SOHO coronagraphs. The eruption was not geoeffective, although future eruptions could be as the active region continues to turn toward Earth.
NASA's Solar Dynamics Observatory recorded the flare's extreme ultraviolet flash:
SHAPE-SHIFTING SUNSPOT: Three big sunspot groups are rotating across the Earth-facing side of the sun. One of them, AR1261, is morphing into a circular ring. Click on the image to view a 24-hour movie:
The magnetic field of this shape-shifting sunspot is crackling with C- and M-classsolar flares, including a powerful M9-blast to begin the day on July 30th. NOAA forecasters estimate a 40% chance of more such flares during the next 24 hours. Readers with solar telescopes are encouraged to monitor developments.
http://www.swpc.noaa.gov/today.html#xray

| SPACE WEATHERNOAA Forecasts | |
Updated at: 2011 Jul 29 2200 UTC
FLARE | 0-24 hr | 24-48 hr |
CLASS M | 40 % | 40 % |
CLASS X | 05 % | 05 % |
Geomagnetic Storms:Probabilities for significant disturbances in Earth's magnetic field are given for three activity levels: active, minor storm, severe storm
Updated at: 2011 Jul 29 2200 UTC
Mid-latitudes
| 0-24 hr | 24-48 hr |
ACTIVE | 05 % | 35 % |
MINOR | 01 % | 15 % |
SEVERE | 01 % | 05 % |
High latitudes
| 0-24 hr | 24-48 hr |
ACTIVE | 05 % | 40 % |
MINOR | 01 % | 20 % |
SEVERE | 01 % | 10 % |
|
http://www.spaceweather.com/ |
*************end update****************
UPDATE: 7-29-2011
| SPACE WEATHERNOAA Forecasts | |
Updated at: 2011 Jul 28 2200 UTC
FLARE | 0-24 hr | 24-48 hr |
CLASS M | 40 % | 40 % |
CLASS X | 05 % | 05 % |
Geomagnetic Storms:Probabilities for significant disturbances in Earth's magnetic field are given for three activity levels:active, minor storm, severe storm
Updated at: 2011 Jul 28 2200 UTC
Mid-latitudes
| 0-24 hr | 24-48 hr |
ACTIVE | 05 % | 05 % |
MINOR | 01 % | 01 % |
SEVERE | 01 % | 01 % |
High latitudes
| 0-24 hr | 24-48 hr |
ACTIVE | 05 % | 05 % |
MINOR | 01 % | 01 % |
SEVERE | 01 % | 01 % |
CHANCE OF FLARES: Sunspot 1260 has developed a delta-class magnetic field that harbors energy for powerful X-class solar flares. Such an eruption today would be Earth-directed as the sunspot turns to face our planet. (continued below)

Note: In yesterday's news item, sunspot 1263 was mislabeled 1262.Sunspot 1260 is leading a parade of big sunspots across the solar disk--one of the finest displays of solar activity in years. Even the smallest dark cores in these sunspot groups are as wide as planets, and they are crackling with C-class flares. Readers with solar telescopes are encouraged to monitor developments.
http://www.solen.info/solar/
| GOES 15 X-Ray Events 1-8A |
| Cur | 29/1739 | B6.8 | Ratio 0.010 |
| Beg | 29/1634 | B7.3 | |
| Max | 29/1640 | C6.3 | Int 2.9e-03 J m-2 |
| End | 29/1646 | C3.3 | |
The GOES X-ray flux plot contains 1 minute averages of solar X-rays in the 1-8 Angstrom (0.1-0.8 nm) and 0.5-4.0 Angstrom (0.05-0.4 nm) passbands. Data from the SWPC Primary GOES X-ray satellite is shown. As of Feb 2008, no Secondary GOES X-ray satellite data is available. Some data dropouts will occur during satellite eclipses.
During the spring and fall, GOES satellites experience eclipses in which the Earth or moon blocks the X-ray instrument view to the sun for a short period every day. Eclipse season lasts for about 45 to 60 days and ranges from minutes to just over an hour. At these times there is a gap in the XRS signal shown.
27/07/2011 |
| After years of inactivity, the Sun is waking up, perhaps profoundly affecting Earth's space environment and the satellites orbiting through it, including the imminent Galileo constellation. Solar storms affect satellite navigation in various ways, starting with the satellites themselves. Components can be unexpectedly upset and gradually degraded by the particle bombardments. Galileo's medium orbit at an altitude of around 23,200km is less protected by the geomagnetic field than other orbit regimes, like low orbits. |
This orbit also takes the satellites through the outer Van Allen radiation belt, one of the two toroidal regions where incoming charged particles are funnelled by the magnetosphere - meaning they will actually have more lifetime radiation exposure than their higher-altitude geostationary equivalents.
Navigation and positioning users on the surface, along with the terrestrial infrastructure overseeing the constellation and producing navigation signals, will also experience unwanted effects.
"Propagating through an energised ionosphere leads to signal delay," explains Stefano Binda, an ESA engineer in the Galileo project. "Ordinary telecommunication systems can just boost through broadcast energy but satellite navigation uses the signal delay to calculate the user's position. "Just a billionth of a second's delay can cause a 30cm error, and the ionosphere can cause errors in the order of several metres."
The uppermost layers of the atmosphere making up the electrically charged ‘ionosphere' are also perturbed. "Right now we are in the upwards phase, with maximum solar activity predicted between 2012 and 2014. "This is an issue of concern for all satellites and therefore also for Galileo, as we begin launching this October and are scheduled to begin operations by mid-2014, right in the heart of the ‘solar max'."
Our parent star makes its presence felt in a variety of ways, from the solar radiation all life relies on to the steady stream of the solar wind, made up of ionised nuclei and electrons.
Then there is the sudden eruption of billions of tonnes of highly energetic charged particles during solar storms - two of which occurred last month.
It typically takes a couple of days for these solar streams to reach our vicinity, where their interactions with Earth's magnetic field can cause spectacular low-latitude auroras, sometimes damaging electrical infrastructure. One 1989 event caused major power outages across Canada.
|
Ice age threat should freeze EPA global warming regs
By: Shannon Goessling | OpEd Contributor | 07/26/11 8:05 PM
Rather than spiraling into a global warming meltdown, we may be heading into the next ice age.
The U.S. National Solar Observatory, the U.S. Air Force Research Laboratory and astrophysicists across the planet report that the nearly all-time low sunspot activity may result in a sustained cooling period on Earth.
The news has sent global warming theory advocates scrambling to discount and explain away the impact on global temperatures. However, the "news" is not really that new.
Many reputable scientists have been warning for decades that we are nearing the end of the 11,500-year average period between ice ages. And the last similar crash in sunspot activity coincided with the so-called "Little Ice Age" in the 1600s that lasted nearly a century.
Despite increasing evidence that "global warming" climate change is not the unified scientific theory it has been promoted to be, vested interests continue to push for stringent limits on carbon dioxide emissions.
Certain investment banks and trading houses that stand to make billions on so-called "carbon credits," and the environmental sociologists who have as a stated purpose to change our way of life, are a powerful bloc.
In the Obama administration, this cabal has a willing "big stick" in the form the U.S. Environmental Protection Agency, which has enacted draconian measures that will, by President Obama's admission, make energy costs "skyrocket."
The subject of intense litigation, the EPA regulations were enacted this year without congressional approval as required by the Clean Air Act and other laws. Estimates put the economic damage of these regulations at $1 trillion over the next 20 years, with a loss of between four and 10 million jobs.
Ironically, the current rush by global warming advocates to uncouple mounting evidence of global cooling from the global warming regime is not the first time they've backpedaled.
As referenced in ongoing litigation, the EPA admitted that generally applicable regulations would lead to "absurd" results, leading the agency to create a so-called "Tailoring Rule."
For example, global warming alarmists admit by their own calculations that reducing carbon emissions among a sample of large U.S. "emitters" to EPA-required levels might reduce the surface temperature by .00071 degree Celsius -- or 70 times lower than what is detectable.
Annual emission reductions sought would be replaced in 13 days by industrial growth in China. "Absurd" is understatement. So how do we handle "global cooling?"
In the 1970s and '80s, climatologists and astrophysicists were setting off alarms about pending global cooling and "the new ice age." Headlines in major weekly news magazines warned of a cooling catastrophe, with experts like famed astronomer Carl Sagan calling on industrialized countries to produce more carbon dioxide to offset the pending disaster.
High-level scientific proposals were advanced to redirect Arctic rivers, clear out swaths of high-density forests to release carbon dioxide, and even salt the Greenland ice caps with black carbon to attract sun melting in a global effort to stave off the impending ice age.
What happens during a "Little Ice Age?" Food-producing land becomes scarcer, food-growing seasons become shorter, and the world becomes a much more arid and less hospitable place. Think food shortages and the social unrest that follows.

The forces at work behind the global warming regulatory regime have, at worst, covered up, ignored and
manipulated climate evidence to make the case that humans cause global warming and therefore humans should be punished.
At best, the mainstream scientific community is continuing to weigh the climate data as it becomes available. Caught in the flux are millions of Americans suffering under an economic tsunami that is anything but a theory.
The textbook definition of moving forward with global warming regulations is truly "absurd."
Shannon Goessling is executive director and chief legal counsel for the Southeastern Legal Foundation.
Read more at the Washington Examiner: http://washingtonexaminer.com/opinion/op-eds/2011/07/ice-age-threat-should-freeze-epa-global-warming-regs#ixzz1TW98imUw
What would you do in the case of wide-spread and long-lasting electrical outage? Do you have flashlights, extra batteries, candles, candle holders, and portable stick-up lights? Do you have a method for cooking your food? Do you have food storage that you can use if the stores run short or you cannot get to a store? You should think about what to do in the case of an emergency that includes the electrical outage scenario. Here is what FEMA says is a good preparedness plan beginning...
Power Outages And Disaster Planning: Lightening The Load If The Lights Go Out
Release Date: June 12, 2006
Release Number: R10-06-018
SEATTLE, Wash. -- June is National Safety Month, with the week of 19 June set aside to stress the importance of emergency preparedness planning. That same week is observed annually as National Lightning Safety Awareness Week. According to FEMA Regional Director John Pennington, while Pacific Northwest communities generally enjoy a pretty robust infrastructure, complacency is a recipe for disaster.
"Our region is prone to a variety of natural disasters, ranging from thunderstorms and resulting lightning strikes, to seasonal flooding, wildfires, earthquakes, and even volcanic activity. Nor can we rule out the threat of terrorism," warns Pennington. "Power grids, generating plants, transformer stations, power poles and even buried cable are vulnerable. As families and businesses review their disaster plans and emergency kits, emergency power needs should rank right up there with food, water, first aid kits and shelter."
Candles may add a spark of adventure during power failures but are dangerous. Flashlights and electric lanterns are safer by far. Battery operated radios and clocks are other essentials, along with a supply of fresh batteries. If electric wheel chairs or electric life support devices are part of the equation, consider extra battery packs or a prearranged agreement from local police or fire stations for priority support.
During a power outage, resist the temptation to call 9-1-1 for information-that's what your battery-powered radio is for. Keep refrigerator and freezer doors closed as much as possible to prevent food spoilage. Turn off electric appliances to protect against power surges when power is restored. Turn off all lights but one (to alert you when power resumes). Plan on cell phones or corded phones for emergency calls - cordless phones require electricity. Don't plug emergency generators into electric outlets or hook them directly to your home's electrical system - as they can feed electricity back into the power lines, putting you and line workers in danger. Keep your car fuel tank at least half-full (gas stations rely on electricity to power their pumps).
When the power comes back on, wait a few minutes before turning on major appliances, to help eliminate problems that could occur if there's a sharp increase in demand. If you think that electric power has been restored to your area but your home is still without power, call your local power company.
FEMA manages federal response and recovery efforts following any national incident. FEMA also initiates mitigation activities, works with state and local emergency managers, and manages the National Flood Insurance Program. FEMA became part of the U.S. Department of Homeland Security on March 1, 2003.
Last Modified: Monday, 12-Jun-2006 10:41:11
http://www.fema.gov/news/newsrelease.fema?id=26962
***************end update*****************************
UPDATE:7-28-2011
WARNING

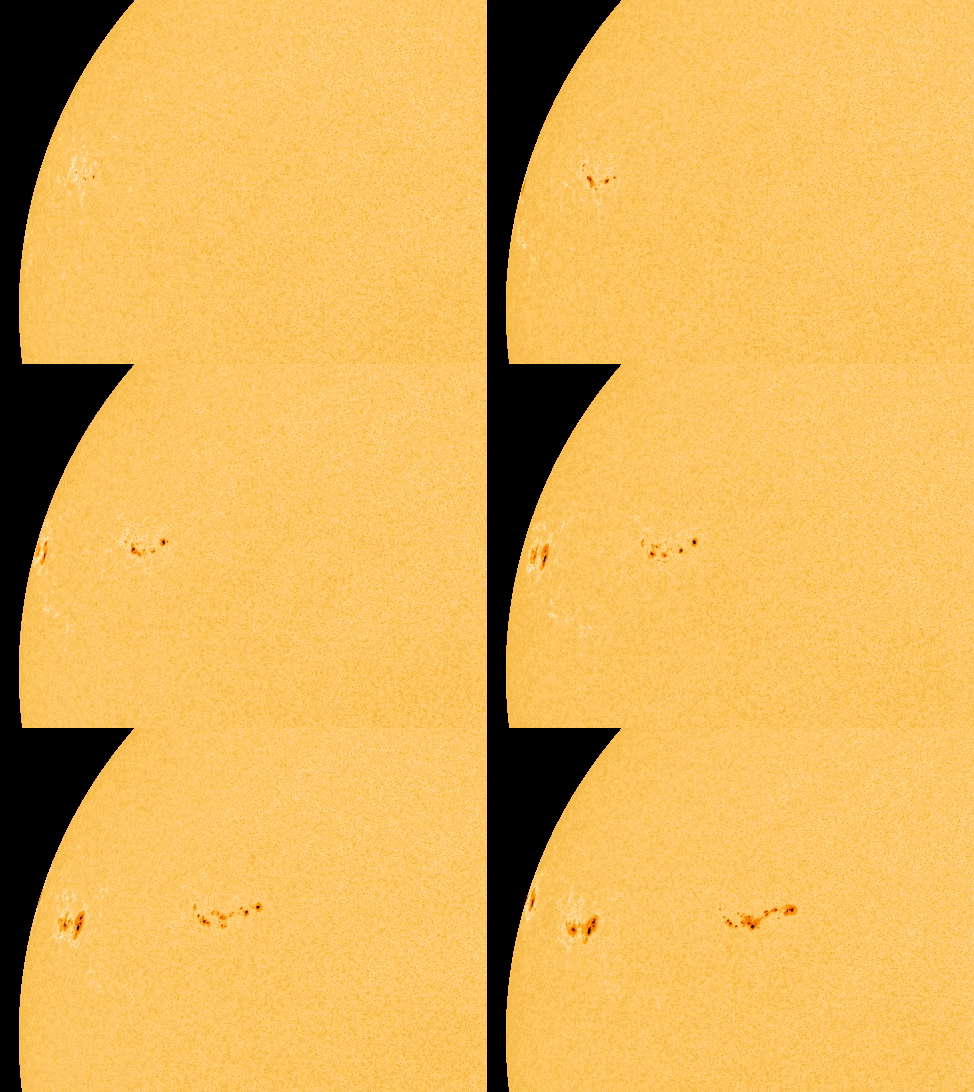
BIG SUNSPOTS: NOAA forecasters estimate a 40% chance of M-class solar flares today. The source would be one of three big sunspots emerging along the sun's northeastern limb. Click on the image to view a 3-day movie from NASA's Solar Dynamics Observatory:
Among the three, the leading sunspot AR1260 is most active. It has produced more than a dozen C-class flares in the past 24 hours, more than doubling the total for the entire month of July so far. New sunspot AR1262, however, could eventually cause more trouble. Magnetograms of the active region reveal a delta-class magnetic field that harbors energy for powerful X-class eruptions. Readers with solar telescopes are encouraged to monitor developments.
more images: from Achim Marian Lucian of Targu Jiu, Gorj, Romania; from Peter Desypris of Island of Syros, Greece; from Gianfranco Meregalli of Milano Italy; from Ron Cottrell of Kitt Peak National Observatory; from John Minnerath of Crowheart, Wyoming; from Cai-Uso Wohler of Bispingen, Germany

The GOES X-ray Flux plot contains 5 minute averages of solar X-ray output in the 1-8 Angstrom (0.1-0.8 nm) and 0.5-4.0 Angstrom (0.05-0.4 nm) passbands. Data from the SWPC Primary GOES X-ray satellite is shown. As of Feb 2008, no Secondary GOES X-ray satellite data is available. Some data dropouts will occur during satellite eclipses.
SWPC X-ray alerts are issued at the M5 (5x10E-5 Watts/m2) and X1 (1x10E-4 Watts/m2) levels, based upon 1-minute data. Large X-ray bursts cause short wave fades for HF propagation paths through the sunlit hemisphere. Some large flares are accompanied by strong solar radio bursts that may interfere with satellite downlinks.
Their page updates dynamically every 5 minutes.
*******************end update*****************************************************
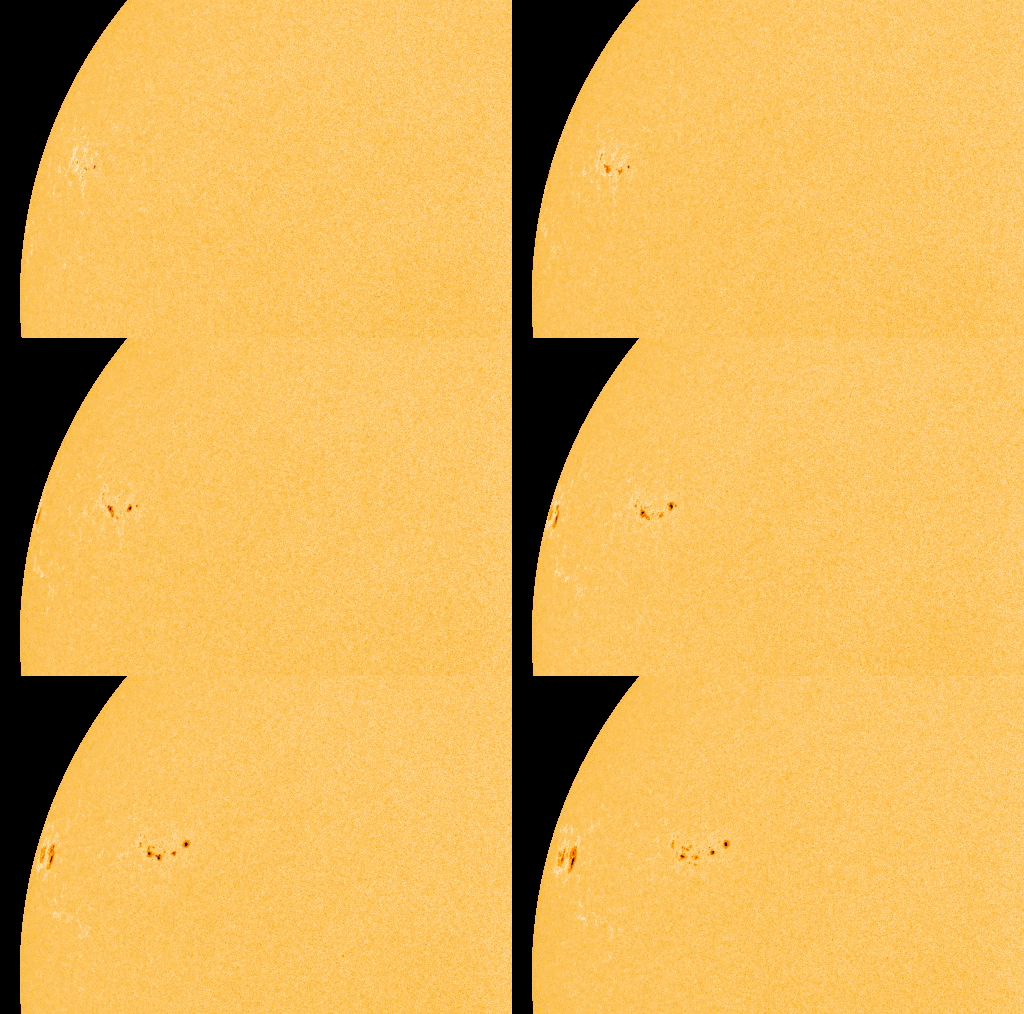
BIG SUNSPOTS: After more than a week of quiet, solar activity is picking up. NASA's Solar Dynamics Observatory is monitoring two big sunspot groups now emerging over the sun's eastern limb. Click on the image to view a 40-hour movie:
The leading sunspot group, AR1260, is crackling with M- and C-class solar flares among a quartet of Earth-sized cores. Not far behind, sunspot AR1261 is larger and may harbor energy for flares of its own. At the moment, these two sunspot groups are too far off disk-center to affect Earth, but this will change in the days ahead. Readers with solar telescopes are encouraged to monitor developments.
Space Weather News for July 27, 2011 – Big Sunspots!
BIG SUNSPOTS: After more than a week of quiet, solar activity is picking up with the emergence of two large sunspot groups on the sun’s northeastern limb. The active regions are crackling with C- and M-class solar flares. So far none of the eruptions has been squarely Earth directed, but that could change in the days ahead as solar rotation turns the sunspots to face our planet. Visit http://spaceweather.com/ for images and more information. Guess I thought you’d want to know:
Space Weather News for July 27, 2011
BIG SUNSPOTS: After more than a week of quiet, solar activity is picking up with the emergence of two large sunspot groups on the sun’s northeastern limb. The active regions are crackling with C- and M-class solar flares.
So far none of the eruptions has been squarely Earth directed, but that could change in the days ahead as solar rotation turns the sunspots to face our planet.
SUNSPOT TELESCOPE: Explore Scientific’s White Light Solar Observing System is perfect for monitoring large sunspots (and small ones too) and it is now available in the Space Weather Store.
After a quiet period a couple fo larger sunspot groups are visible on the Sun today. Sunspot numbers 1260 & 1261
These are earth sized spots which aren’t in a position at present to affect us yet with their M and C class flare activity.
Since I have been asked to explain more what is meant by the flares and CME’s and effects they may have on Earth, I share the following:
Flare activity is classified into 3 categories accordign to their brighness in XRAY wavelengths. Within each category there are 9 sub divisions.
X-class flares are big; they are major events that can trigger planet-wide radio blackouts and long-lasting radiation storms.Most cause just cause soem disruption to satellite and radio communications and noise in some imaging systems.
M-class flares are medium-sized; they can cause brief radio blackouts that affect Earth’s polar regions. Minor radiation storms sometimes follow an M-class flare.
Compared to X- and M-class events,C-class flares are small with few noticeable consequences here on Earth. These are the most common.
On July 14th 2000, there was an X6 flare which triggered an S3 radiation storm which due to the date became known as the”Bastille Day Event”. The storm occured only 15 minutes followed the flare. These major events can cause awasome geomagnetic storms resulting in spectacular auroras. This event was tje biggest solar radiation vent since 1989.
The really interesting thing from my point of view – given my interest in Voyager Space craft was that this event was observed by both space craft – making it the farthest out observed soalr storm.
This year on Valentine’s Day we had another X class flare event which had made pretty sky displays but had no direct other impact on Earth.
A NASA study in 2009 showed that the risk related to major flare events and space weather can impact on space borne and ground based technological systems.
For example they suggest that space weather can
- Produce solar storm electromagnetic fields that induce extreme currents in wires, disrupting power lines, causing wide-spread blackouts and affecting communication cables that support the Internet.
- Produce solar energetic particles and the dislocation of the Earth’s radiation belts, which can damage satellites used for commercial communications, global positioning and weather forecasting.
Alan Boyle: Cosmic Log
Solar region could spark big space storms
• July 23, 2004 | 8:35 p.m. ETWatch out for huge sunspot: A sunspot big enough to be seen by the naked eye (but don't!) is pointing straight at Earth and has already sparked a wave of auroras, also known as northern or southern lights. Sunspot 652, which is wider than the planet Jupiter, is capable of generating the most powerful class of solar flares, known as the X-class. Last fall, an unprecedented wave of X-class flares blasted so much electrically charged material toward Earth that it caused satellites to fail and stressed a power grid in Sweden. It's not clear whether the new sunspot could unleash that kind of power, but if it did, its bull's-eye placement on the sun's disk would send the blast directly at us.
One geomagnetic storm wave already has swept past Earth's magnetic field, according to an advisory from SpaceWeather.com, but the main effect of that outburst was to create enhanced auroras as far south as Wisconsin on Thursday night.
 |
NASA / ESA Sunspot 652 is the disturbance at the center of this image from the Solar and Heliospheric Observatory.
|
SpaceWeather's online gallery offers a selection of picturesque snapshots, and there's an amazing picture of the sunspot as seen from Pisa in Italy. As explained in our sun viewing guide, you should never gaze directly at the sun without adequate protection. But there's no need to limit your sun exposure this summer weekend because of the potential for a solar storm. Our atmosphere protects people on Earth from the radiation effects of the harshest coronal mass ejection, although astronauts and high-altitude fliers might receive extra exposure from a solar outburst.
To keep up to date on the space weather forecast over the weekend, check SpaceWeather.com or the National Oceanic and Atmospheric Administration'sSpace Environment Center. The center expects geomagnetic activity from the previous outburst to settle down over the weekend, but its forecastalso says solar activity is expected to be "moderate to high," with Sunspot 652 still capable of producing major flares. Generally speaking, the sun is on a downward curve in its 11-year activity cycle, and experts are becoming much more savvy about protecting satellites and power grids from solar blasts. So chances are that the most visible impact of solar flare-ups will be those beautiful northern lights.
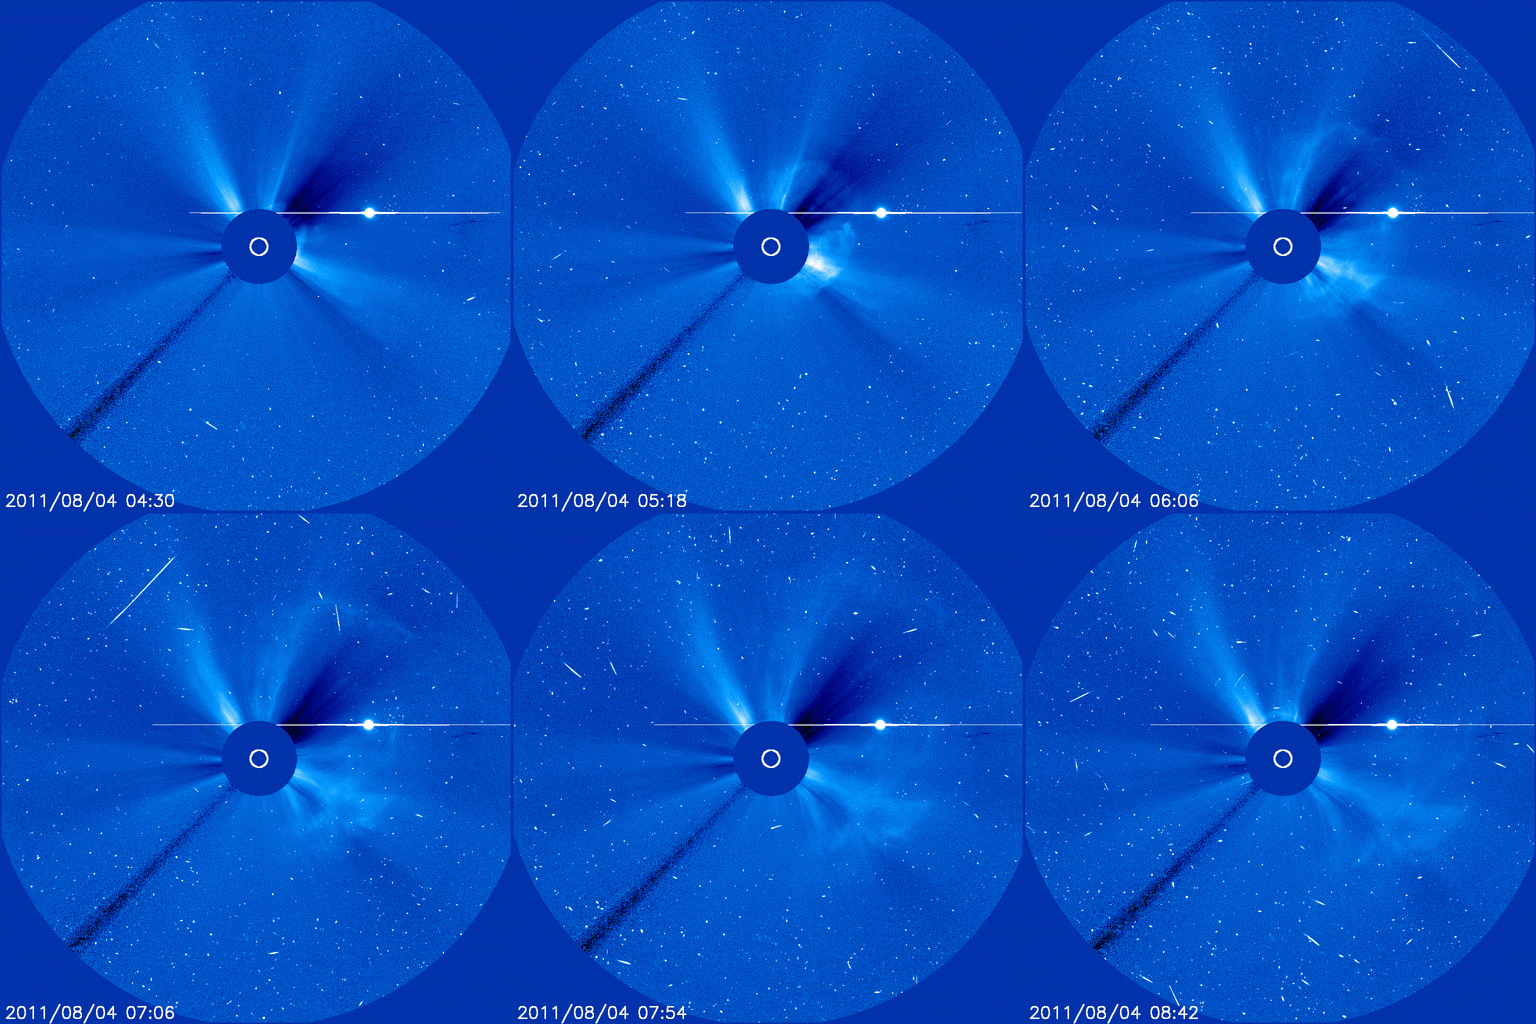
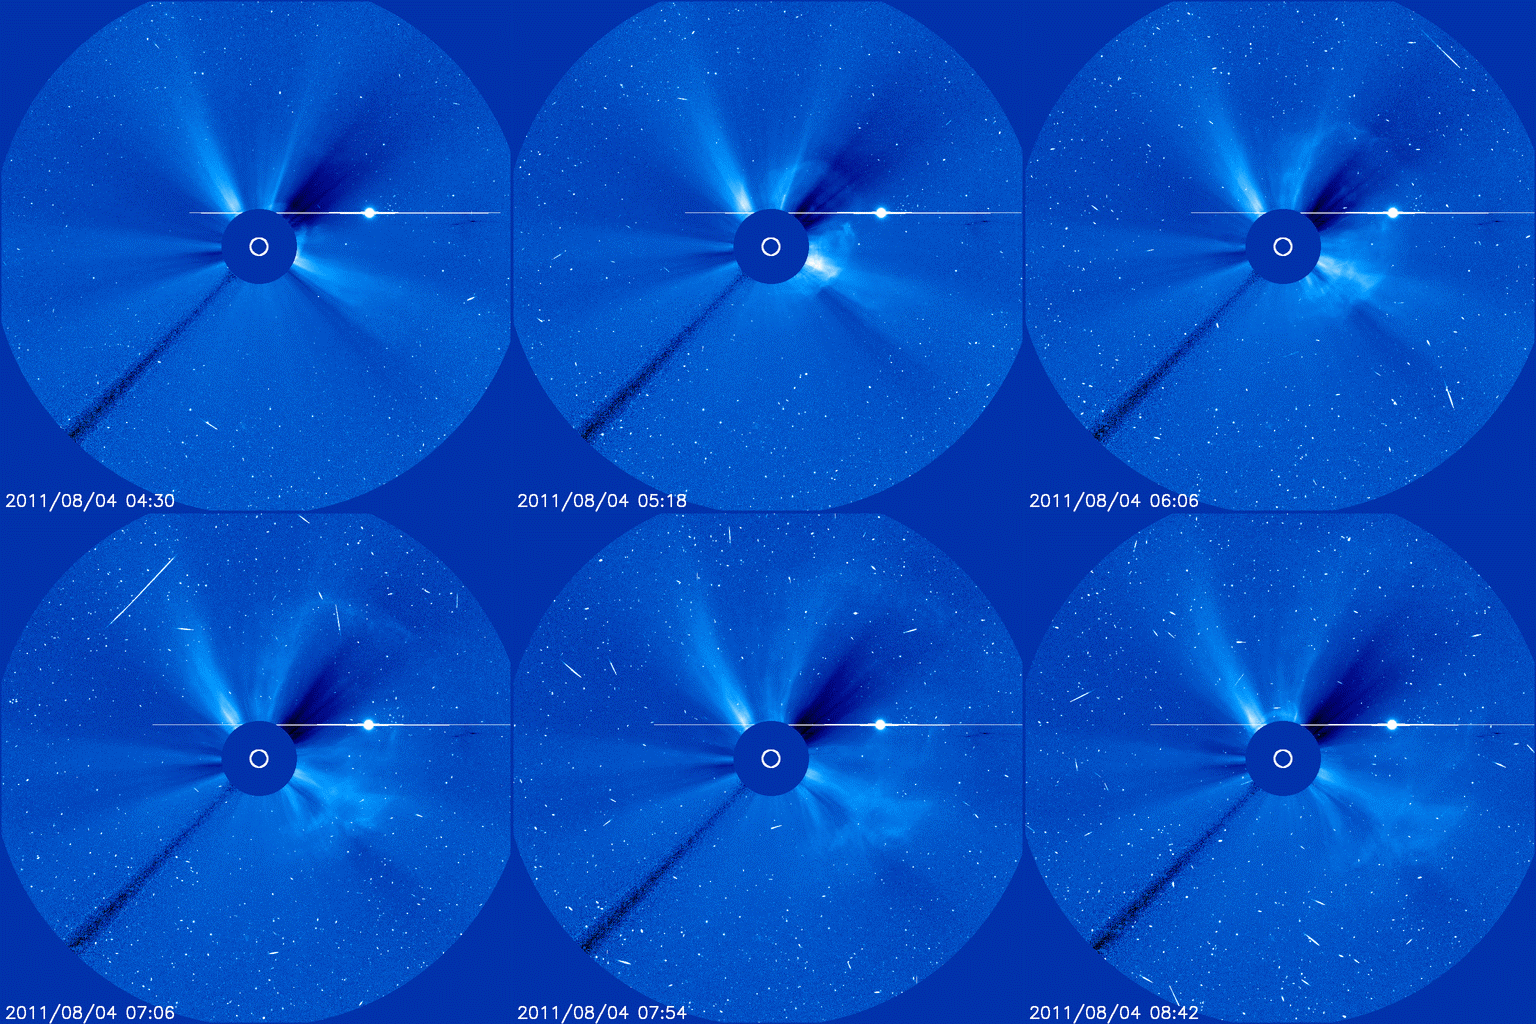
The eruption propelled a bright coronal mass ejection (CME) toward Earth. Click on the image to view a movie of the expanding cloud recorded by the Solar and Heliospheric Observatory:

Note: The many speckles in this movie are caused by energetic solar protons hitting the camera.
...the combined cloud should reach Earth on August 5th at 13:55 UT plus or minus 7 hours: "The impact on Earth is likely to be major. The estimated maximum geomagnetic activity index level Kp is 7 (Kp ranges from 0 - 9). The flanks of the CME may also impact STEREO A, Mars and Mercury/MESSENGER." High-latitude sky watchers should be alert for auroras.
http://www.spaceweather.com/%20
NOTICE... the geomagnetic storm(s) are not just affecting the high latitudes this time.
| SPACE WEATHERNOAA Forecasts | |
Updated at: 2011 Aug 03 2200 UTC
FLARE | 0-24 hr | 24-48 hr |
CLASS M | 65 % | 65 % |
CLASS X | 10 % | 10 % |
 Geomagnetic Storms:Probabilities for significant disturbances in Earth's magnetic field are given for three activity levels: active, minor storm, severe storm
Updated at: 2011 Aug 03 2200 UTC
Mid-latitudes
Geomagnetic Storms:Probabilities for significant disturbances in Earth's magnetic field are given for three activity levels: active, minor storm, severe storm
Updated at: 2011 Aug 03 2200 UTC
Mid-latitudes
| 0-24 hr | 24-48 hr |
ACTIVE | 05 % | 40 % |
MINOR | 01 % | 10 % |
SEVERE | 01 % | 05 % |
High latitudes
| 0-24 hr | 24-48 hr |
ACTIVE | 05 % | 40 % |
MINOR | 01 % | 15 % |
SEVERE | 01 % | 05 % |
| |

http://www.spaceweather.com/
What are some of the effects of solar flares on Earth?
I already know that solar flares cause the earth's atmosphere to become more ionized and has an effect on radio signals which causes a disruption in wireless communication. Is there any additional information you can give me on this idea and the effect of solar flares?
There are many effects of solar flares (and related solar processes) on Earth. I suggest you go check this
site which lists the effects of the Sun on the Earth, including solar flares.

The direct effects of solar flares are mainly related to communications and radio transmissions, which you already seem to know about. Solar flares are often associated with coronal mass ejections, the ejections of electrons, protons and ions from the Sun. These charged particles have some other effects on Earth. The Earth has a natural protection against these charged particles: its magnetic field and atmosphere that blocks most of them. However, some charged particles can enter the atmosphere at the poles.
One of the most spectacular (and extremely beautiful) consequence of this are auroras. When charged particles (especially electrons) find their way at the poles, they get accelerated along the lines of the magnetic field and collide with the particles in the atmosphere which makes them glow. That glow is what we see as an aurora.
There are also health issues for ailine pilots and astronauts. For those of us that spend most of our time on the ground, the magnetic field and the atmosphere block out almost all of the harmful radiation and charged particles. This is not the case when you go up in the atmosphere. Airline pilots that fly at great altitude, and especially near the poles, are exposed to more of these. The same goes for astronauts. This results in a higher incidence of cancer among airline pilots and cabin crew. Astronauts have even reported seeing flashes of light because of high energy protons hitting their eyes!
SOLAR PROTON EVENT:
Solar protons normally have insufficient energy to penetrate through the Earth's magnetic field. However, during unusually strong solar flare events, protons can be produced with sufficient energies to penetrate deeper into the Earth's magnetosphere and ionosphere. Regions where deeper penetration can occur includes the
north pole,
south pole, and
South Atlantic magnetic anomaly.
Protons are charged particles and are therefore influenced by magnetic fields. When the energetic protons leave the
Sun, they preferentially follow (or are guided by) the Sun's powerful magnetic field. When solar protons enter the domain of the Earth's
magnetosphere where the magnetic fields become stronger than the solar magnetic fields, they are guided by the Earth's magnetic field into the polar regions where the majority of the Earth's magnetic field lines enter and exit.
Energetic protons that are guided into the polar regions collide with atmospheric constituents and release their energy through the process of ionization. The majority of the energy is extinguished in the extreme lower region of the ionosphere (around 50-80 km in altitude). This area is particularly important to ionospheric radio communications because this is the area where most of the absorption of radio signal energy occurs. The enhanced ionization produced by incoming energetic protons increases the absorption levels in the lower ionosphere and can have the effect of completely blocking all ionospheric radio communications through the polar regions.
Such events are known as Polar Cap Absorption events (or PCAs). These events commence and last as long as the energy of incoming protons at approximately greater than 10 MeV (million electron volts) exceeds roughly 10 pfu (pfu = proton flux units = particles⁄sr·cm2·s) at geosynchronous satellite altitudes.

The more severe proton events can be associated with geomagnetic storms that can cause widespread disruption to
electrical grids. However, proton events themselves are not responsible for producing anomalies in power grids, nor are they responsible for producing geomagnetic storms. Power grids are only sensitive to fluctuations in the Earth's magnetic field.
Extremely intense solar proton flares capable of producing energetic protons with energies in excess of 100 MeV can increase neutron count rates at ground levels through secondary radiation effects. These rare events are known as Ground Level Events (or GLE's).
There is no substantive scientific evidence to suggest that energetic proton events are harmful to human health at ground levels, particularly at latitudes where most of the Earth's population resides. The Earth's magnetic field is exceptionally good at preventing the radiative effects of energetic particles from reaching ground levels. High altitude commercial transpolar aircraft flights have measured increases in radiation during energetic proton events, but a warning system is in place that limits these effects by alerting pilots to lower their cruising altitudes. Aircraft flights away from the polar regions are far less likely to see an impact from solar proton events.
Significant proton radiation exposure can be experienced by astronauts who are outside of the protective shield of the Earth's magnetosphere, such as an astronaut in-transit to, or located on the Moon. However, the effects can be minimized if astronauts are in a low-Earth orbit and remain confined to the most heavily shielded regions of their spacecraft. Proton radiation levels in low earth orbit increase with orbital inclination. Therefore, the closer a spacecraft approaches the polar regions, the greater the exposure to energetic proton radiation will be.
Astronauts have reported seeing flashes or streaks of light as energetic protons interact with their optic tissues. Similar flashes and streaks of light occur when energetic protons strike the sensitive optical electronics in spacecraft (such as star trackers and other cameras). The effect can be so pronounced that during extreme events, it is not possible to obtain quality images of the Sun or stars. This can cause spacecraft to lose their orientation, which is critical if ground controllers are to maintain control.
Energetic proton storms can also electrically charge spacecraft to levels that can damage electronic components. They can also cause electronic components to behave erratically. For example, solid state memory on spacecraft can be altered, which may cause data or software contamination and result in unexpected (phantom) spacecraft commands being executed. Energetic proton storms also destroy the efficiency of the solar panels that are designed to collect and convert sunlight to electricity. During years of exposure to energetic proton activity from the Sun, spacecraft can lose a substantial amount of electrical power that may require important instruments to be turned off.
EXPLAINING THE Kp DATA MENTIONED BY SPACE WEATHER.COM:
A particularly useful predictor of the aurora that scientists use is the Kp index, also called the planetary-K index, which is compiled from magnetometer measurements at 13 stations that have records going back to 1949. Every 3-hour period of each day is assigned a Kp activity level between 0 and 9, somewhat similar to the Richter scale for earthquakes or the Beaufort scale for wind and storms. A Kp level of 0 means exceptionally quiet, whereas more disturbed times are described as:
Kp = 4: Calm Conditions
Kp = 5: Minor storm conditions
Kp = 6: Moderate storm conditions
Kp = 7: Strong storm conditions
Kp = 8: Severe storm conditions
Kp = 9: Extreme storm conditions
Kp levels of 0 to 4 are common; above 5 the Kp levels become increasingly rare, such that storms registering a Kp of 9 may only be observed a couple of times a year, or not at all during quiet periods of the solar cycle.
I am repeating an article from National Geographic regarding solar flares because it is now very applicable...
Published June 8, 2011
Solar Flare Sparks Biggest Eruption Ever Seen on Sun
Enormous ejection of particles into space shocks scientists.

A solar flare created a spectacular eruption on June 7 (pictured).
Image courtesy SDO/NASA
Dave Mosher
A mushroom of cooled plasma popped like a pimple and rained onto the surface of the sun yesterday—shooting perhaps the largest amount of solar material into space ever seen, scientists say. ...
Instead, what shocked scientists was the unusual amount of material that lofted up, expanded, and fell back down over roughly half the surface area of the sun. The event's simultaneous launch of particles into space is called a coronal mass ejection (CME).
"
This totally caught us by surprise. There wasn't much going on with this spot, but as it came from behind the sun, all of the sudden there was a flare and huge ejection of particles," said astrophysicist
Phillip Chamberlin of NASA's Solar Dynamics Observatory (SDO), one of several spacecraft that recorded the event.
"We've never seen a CME this enormous."
...But he warned space-weather experts are concerned about future solar events.
The sun's 11-year cycle of activity, driven by tangled surface magnetic fields, will hit its maximum in late 2013 or early 2014. Magnetic messiness will peak around that time and prompt nasty solar storms.
"We'll probably see [extreme] flares every couple of months instead of years," Chamberlin said.
If one of these powerful flares—and its coronal mass ejection—faces Earth, the particles will pound satellite components with charged particles, short some out, and potentially cripple them.
On the planet's surface, extra currents of solar particles drive extra electric current through power lines and heat them up. A
solar storm in 1859, for example, caused telegraph lines to burst into flames. Power companies distribute loads to avoid such a disaster, but energetic solar storms could still blow transformers and lead to power outages, especially during heat waves like the one sweeping the eastern U.S. this week.
"Despite great countermeasures, the power grid is still vulnerable. We could be in for some serious problems," Chamberlin said.
http://news.nationalgeographic.com/news/2011/06/110608-solar-flare-sun-science-space/
***********************end update*********************************
Update: 8-3-2011
 Graphic depicts the trajectory of asteroid 2012 DA14 on Feb 15, 2013. In this view, we are looking down from above Earth's north pole. Image credit: NASA/JPL-Caltech
 Graphic depicts the trajectory of asteroid 2012 DA14 during its close approach, as seen edge-on to Earth's equatorial plane. The graphic demonstrates why the asteroid is invisible to northern hemisphere observers until just before close approach: it is approaching from "underneath" our planet. On the other hand, after close approach it will be favorably placed for observers in the northern hemisphere. Image credit: NASA/JPL-Caltech