Ad

Showing posts with label FAMILY PREPAREDNESS PLAN. Show all posts

Friday, September 9, 2011

Geomagnetic Storm With Electrical Ground Currents Detected In Norway. Multiple M-Class Solar Flares In The Past 24 Hours. How To Prepare For A Super Geomagnetic Storm.


GEOMAGNETIC STORM: A polar geomagnetic storm (Kp=5) is in progressfollowing the impact of a CME around 1100 UT on Sept. 9th. This could be the first of several hits from a series of CMEs expected to reach Earth during the weekend. High-latitude sky watchers should be alert for auroras after nightfall. Aurora alerts:textvoice.

Update: Electrical ground currents caused by the storm have been detected in Norway.


ACTIVE SUNSPOT: Sunspot 1283 is producing flares so intense they are visible through solar telescopes in backyards 93 million miles away. Amateur astronomer Andy Devey photographed this one, and M6-class eruption, from Barnsley UK on Sept. 8th:
The magnetic canopy of sunspot 1283 has an unstable "beta-gamma-delta" configuration tthat harbors energy for more powerful eruptions. NOAA forecasters estimate a 75% chance of M-flares and a 25% chance of X-flares during the next 24 hours.


3-day GOES X-ray Plot3-day Estimated Planetary K-index graph
www.spaceweather.com


3-day GOES Magnetometer Hp component plot


The GOES Hp plot contains the 1-minute averaged parallel component of the magnetic field in nanoTeslas (nT), as measured at GOES-13 (W75) and GOES-15 (W89). The Hp component is perpendicular to the satellite orbit plane and Hp is essentially parallel to Earth's rotation axis. If these data drop to near zero, or less, when the satellite is on the dayside it may be due to a compression of Earth's magnetopause to within geosynchronous orbit, exposing satellites to negative and/or highly variable magnetic fields. On the nightside, a near zero, or less, value of the field indicates strong currents that are often associated with substorms and an intensification of currents in the Earth's geomagnetic tail.
http://www.swpc.noaa.gov/rt_plots/mag_3d.html


Noon and midnight local time at the satellite are plotted as N and M. Default scaling is 0 to 200 nanoTesla. Non-default scaling to include infrequent extreme values is lableled in red to emphasize the change in scale.

For real time monitors, click here...http://www.swpc.noaa.gov/rt_plots/index.html

Recommended Actions Immediately Prior to Massive Solar Storm

Emergency preparedness prior to the imminent storm...
1. Extra Batteries
2. Gasoline
3. Cooking Fuel
4. Prescription Medicine
5. Liquid Cash
6. Water
7. Bleach
8. Food
9. Can Opener
10. If you commute via subway, or other electrically depended corridor, you should carry a pair of supportive walking shoes.
11. Avoid elevators when you know that the storm is coming
12. Airlines – Avoid flying during a massive solar storm with a similar intensity to the Great Solar Storm of 1859. If you chose to fly, you will expose yourself to higher levels of nuclear particle radiation and the electronics within the aircraft will also be subjected to greater failure rate due to this radiation exposure.
13. Have an emergency back-up way for communication and a meeting spot for your loved ones that is planned in the case of emergency.
14. Radio  Battery powered or hand crank radios ar e a vital communication/ informational link during a major blackout.
15. Rechargeable batteries
16. Disconnecting Power
17. Automatic Back-up Generators
18. Buckets for carrying water
19. Vitamins
20. Toilet paper
21. Reading books
22. Prepare to take care of your pets as well.
23. Climate needs, i.e., extra water in warm/hot climates, extra blankets and gas or wood fireplace during cold climates.
24. Garage Door.  Know how to open it without power.

You'll be glad that you prepared ahead of time in the case of any emergency.


Friday, August 26, 2011

Hurricane Irene Insurance Tips & State-By-State Preparedness

6 insurance tips to prepare for Hurricane Irene

Hurricane Irene is bearing down on the East Coast. In its path are cities that haven't taken direct hits from a hurricane in years, and in some cases decades.

It's a good time to review how much hurricane damage coverage you can expect from standard homeowners, renters and automobile policies. Here are six insurance tips as the East Coast braces for Irene:

1. Take a property inventory: It's easier to file a damage claim if you know exactly what you own, and can document it. Free online software to help ease the process is available from the Insurance Information Institute at www.knowyourstuff.org . The software enables users to upload photos of property as well as scanned receipts from major purchases. Or, a homeowner can write down a list of major property in a notebook, and take photos, noting key information about each item on the back.

2. Check policies: Read your insurance documents and review the scope of your existing coverage. Know your policy numbers, and where to call to file a claim. Call your agent or insurer with any questions. If you don't have hardcopy of your policy, be sure to check it online before the storm hits — you may not have power for a while after the storm. Don't expect to get a new or expanded policy in place before Irene hits. Insurers typically bar last-minute coverage changes as storms approach.

3. Know your policy's hurricane deductible: A standard homeowners policy includes a deductible, meaning the homeowner must pay for a portion of the damages before insurance covers the rest. Typically, that's either $500 or $1,000. However, out-of-pocket expenses for hurricane damages can be much higher. In 18 states on the East and Gulf coasts, insurers are allowed to include hurricane deductibles in homeowners policies. These amounts apply only to hurricane-caused damage, and typically range from 1 percent to 5 percent of the insured value of a home. Deductibles may be higher in some coastal areas. For example, a policyholder whose home is insured for $200,000 with a 2 percent hurricane deductible would have to pay the first $4,000 to repair hurricane damage.

The hurricane-prone states that allow insurers to assess hurricane deductibles include: Alabama, Connecticut, Delaware, Florida, Georgia, Hawaii, Louisiana, Maine, Maryland, Massachusetts, Mississippi, New Jersey, New York, North Carolina, Rhode Island, South Carolina, Texas and Virginia. The District of Columbia is included.

"Many homeowners have forgotten about these deductibles, because they live in places that haven't had a hurricane for years," said Michael Barry, a spokesman for the Insurance Information Institute.
http://www.msnbc.msn.com/id/44292077

Family Hurricane Preparedness Tips
As we enter the 2011 Hurricane Season, which experts are predicting to be very active, the Massachusetts Emergency Management Agency (MEMA) is offering personal preparedness tips for the all of the citizens of the Commonwealth.

“Every home and business should have a stocked basic emergency supply kit that could be used for any emergency, regardless of the time of year,” states MEMA Acting Director Kurt Schwartz. “Everyone should keep certain items around the house and workplace in the event you are isolated for three to five days without power”

Each kit will be unique to each family, but should include a portable radio, flashlight, extra batteries, a supply of non-perishable foods, along with bottled water, a first aid kit, extra prescription medication, and extra food and supplies for infants and pets.

“All families should develop a ‘Family Emergency Communication Plan’ to help ensure everyone is safe. You should contact your local authorities to learn about your community’s potential evacuation routes and the location of emergency shelters,” said Schwartz. “It is important to familiarize yourself with your Community’s Emergency Plans before an emergency situation occurs.”

Develop a Disaster Supply Kit ‘Go Bag’, with essentials in case you must evacuate quickly.

1. HURRICANE DISASTER SUPPLY KIT
•Canned goods and nonperishable foods that do not need cooking:
◦Canned meats and fish
◦Canned fruits and vegetables
◦Canned soups and puddings
◦Canned fruit juices
◦Dried fruit and nuts
◦Bread, cookies and crackers
◦Peanut butter and jelly
◦Coffee and tea
•Manual can opener
•Bottled water (1 gallon per person/per day)
more here http://www.msnbc.msn.com/id/44275604

No matter where you live, officials say everyone should assemble an emergency supply kit (including a gallon of drinking water per person per day, nonperishable foods, a can opener, a first-aid kit, a flashlight, a battery-operation radio and extra batteries, a whistle, iodine tablets, personal hygiene items, a phone that does not rely on electricity, and child care supplies).

Those who live in an evacuation zone also need to:

- prepare a disaster plan (determine how to locate and communicate with family members, and make sure the home is properly insured); - know where to go (finding friends or family to stay with outside the evacuation zone, or report to a hurricane shelter); - keep a small "go bag" ready (which should include copies of important documents in a waterproof container; extra sets of keys; copies of credit and ATM cards; $50 to $100 in cash; up-to-date medication information and other essential personal items; first-aid kit; contact and meeting information for family members; child care supplies).

You can make sure you've got everything with this handy checklist.

Homeowners should secure their properties. Storm shutters are the best type of protection, but if you don't have those, board up windows with marine plywood. Additional clips or straps are recommended to secure roofs.

Bring in loose, lightweight objects such as lawn furniture, potted plants, garbage cans, garden tools and toys. Anchor objects that would be unsafe outside, such as gas grills or propane tanks. Close up and secure patio umbrellas, and secure retractable awnings.

Remove aerial antennas and satellite television dishes.

Trees and shrubs around your home should also be well-trimmed. Also remember to clear your gutters.
New York state offers all-hazard alerts through NY-ALERT (sign up at nyalert.gov). The city offers the latest information on nyc.gov or at 311.

Residents should also monitor the National Hurricane Center to stay aware of current weather conditions. NBC New York's weather page is continuously updated here. The website will always stay updated and carry live streams from the newsroom and weather center in emergencies. http://www.msnbc.msn.com/id/44262817

State-by-state look at hurricane preparedness

Aug. 26, 2011, 3:16 p.m. EDT
Delaware County Daily Times
Here is a state-by-state glance on how Hurricane Irene is predicted to strike states all along the Eastern Seaboard as of Friday morning:
CONNECTICUT
— Forecasters predict Irene to make landfall on Sunday somewhere between New Jersey and Cape Cod.
— Hurricane warnings have not been issued.
— Mandatory evacuations have not been ordered.
— Last hurricane to hit was Bob in 1991.
DELAWARE
— Hurricane warning statewide
— Flood watch in effect
— Storm center to pass near the New Jersey/Delaware coast around 8 a.m. Sunday.
— Governor orders mandatory evacuation of coastal areas by 9 a.m. Saturday
— Last hurricane to hit was Floyd in 1999.
— State will open shelters in all three counties on Friday.
MAINE
— Forecasters predict Irene to reach northern New England Sunday night.
— Heavy rain expected to start Saturday night. Potential for flooding rains and gusty winds.
— No evacuations planned since path uncertain.
— Lobstermen began moving their fishing gear farther offshore to avoid damage amid expectations of 30-foot seas.
MARYLAND
— Hurricane warning for St. Mary's County and Chesapeake Bay near the mouth of the Potomac River.
— Tropical storm warning for Baltimore to Eastern Shore to D.C. suburbs.
— Flash flood watch in Baltimore-Washington metro region and southern Maryland.
— Mandatory evacuations ordered for Ocean City and coastal Worcester County.
— Governor declared emergency.
— Last hurricane to hit was Floyd in 1999.
— Assateague State Park closing until Wednesday; most state park campgrounds closed.
MASSACHUSETTS
— Forecasters predict Irene to make landfall in southern New England on Sunday. They say they are unable to determine where it would hit land first because forecasts show that could be anywhere between New Jersey and Cape Cod.
— Hurricane warnings have not been issued in the state. A hurricane watch is in effect for the coast line to the mouth of the Merrimack River.
— Mandatory evacuations have not been ordered.
— Last hurricane to hit was Bob in 1991.
— Red Cross is pre-positioning emergency response vehicles, mobilizing trained disaster workers and preparing supplies in case they are needed.
— Boston's largest homeless shelter is also beginning to warn people living in the streets about the approaching hurricane. Pine Street Inn is also preparing to open its doors around the clock from Saturday afternoon through Monday, and it is strongly urging the homeless to come in for safety.
NEW HAMPSHIRE
— Forecasters predict Irene to reach northern New England Sunday night.
— Heavy rain expected to start Saturday night. Potential for flooding rains and gusty winds.
— No evacuations planned since path uncertain.
— Governor directed state Emergency Operations Center to be opened.
— The Red Cross plans to open four shelters.
— Organizers of the annual Hampton Beach Talent Competition condensed the three-night schedule to two, telling competitors "it's one song for all the marbles."
NEW JERSEY
— Forecasters predicted storm would pass over, or more likely, near New Jersey by midday Sunday.
— Hurricane warning in effect for coastal and southern counties.
— Mandatory evacuations ordered for nearly 1 million visitors and residents of Cape May County, coastal Atlantic County and Long Beach Island.
— Governor declared emergency for the state.
— New Jersey Transit trains to shut down Saturday.
— Last hurricane to directly hit the state was remnants of Hurricane Floyd, which caused major flooding inland in 1999.
— Atlantic City casinos shutting down for only the third time since gambling was legalized 33 years ago.
NEW YORK
— Forecasters predict Irene to make landfall Sunday as a Category 1 storm between New Jersey and Cape Cod.
— The National Weather Service has issued a hurricane watch and a flood watch for Long Island, New York City and Rockland, Westchester and Putnam counties.
— New York City Mayor Michael Bloomberg ordered the evacuation of nursing homes and hospitals located in low-lying coastal areas, such as Battery Park City in lower Manhattan, Coney Island in Brooklyn and Far Rockaway in Queens, beginning Friday.
— The governor declared a state of emergency and the state's Office of Emergency Management has increased staffing in its underground bunker.
— Last hurricane to hit was Hurricane Gloria in 1985 on Long Island as a Category 2 storm with winds gusts of up to 100 mph. Since then, numerous remnants of hurricanes that have struck the state.
— The governor says New York City's public transit will halt around noon Saturday because of the hurricane.
NORTH CAROLINA
— Forecasters predict Irene to make landfall Saturday morning east of Morehead City. Early storm surge prediction of up to 11 feet in Pamlico Sound and up to 9 feet along Outer Banks.
— Hurricane warning for entire coast.
— Governor and president declared emergency for the state.
— Evacuations ordered for all of the Outer Banks as well as inland Currituck County, Dare County, Hyde County and low-lying areas of Beaufort County. Voluntary evacuation requested for New Hanover County.
— Last hurricane to hit was Isabel in 2003.
— The Red Cross is opening eight shelters for people who need them. Nearly 50 other shelters ready to open as needed.
PENNSYLVANIA
— Hurricane warnings are in effect for Philadelphia and Delaware counties, with tropical storm warnings in effect for three other suburban counties.
— Gov. Tom Corbett has declared state of emergency in advance of expected arrival of wind and rain.
— Although the exact track of the storm is uncertain, tropical storm conditions could begin as early as Saturday afternoon.
— Irene is expected to bring a half-foot or more of rain to already sodden communities. Before storms associated with Irene have arrived Philadelphia has already set an all-time single-month record for rain with more than 13 inches.
— The mayor says mass transit in suburban Philadelphia, will halt at 12:30 a.m. Sunday because of the hurricane.
— Mandatory evacuations have not been ordered.
— Last hurricane to hit was Floyd in 1999.
— Flood and flash flood watches are in effect for nine other counties in eastern Pennsylvania through Sunday.
RHODE ISLAND
— Forecasters predict Irene to make landfall on Sunday evening. Six-to-10 inches of rain expected to fall beginning as early as Saturday night.
— Gov. Lincoln Chafee has declared a state of emergency.
— Hurricane watch issued Friday for much of the state. Tropical storm watch for portions of two inland counties.
— No mandatory evacuations.
— Last hurricane to hit was Bob in 1991, which made landfall twice.
SOUTH CAROLINA
— Forecasters predict Irene to be about 140 miles east of Myrtle Beach late Friday night.
— Tropical storm warnings issued from Edisto Island north to North Carolina state line.
— No mandatory evacuations ordered.
— Last hurricane to hit was Charley in 2004.
— Downtown Charleston reported 49 mph wind gust just before noon Friday.
— Wind gusts of up to and as much as of rain expected around Myrtle Beach.
— About 3,500 customers without power along coast late Friday morning as outer bands of storm approach.
VERMONT
— Forecasters predict Irene to reach northern New England Sunday night.
— Heavy rain expected to start Saturday night. Potential for flooding rains and gusty winds.
— No evacuations planned since path uncertain.
— Parts of the state hard-hit by Memorial Day weekend flash flooding were bracing for another round.
VIRGINIA
— Forecasters predict Irene to make landfall at 2 a.m. Sunday.
— Hurricane watch for coast.
— Mandatory evacuations ordered for the Sandbridge section of Virginia Beach, a barrier island dotted with rentals, Accomack on the Eastern Shore, and for low-lying areas of Norfolk and Hampton.
— Governor declared emergency.
— Last hurricane to hit the state was Hurricane Isabel in 2003.
— The cities of Norfolk, Virginia beach and Hampton are opening shelters on Friday.
— The Navy ordered the Second Fleet out to sea to escape the storm.
WASHINGTON, D.C.
— Tropical storm warning
— No mandatory evacuations ordered.
— Last hurricane to hit was Hazel in 1954.
— Approach of hurricane forced postponement of Sunday's dedication of Martin Luther King Jr. Memorial
— Impending storm prompts Walter Reed Army Medical Center to accelerate transfer of last remaining patients to new facility in Bethesda, Md.
http://www.pennlive.com/newsflash/index.ssf/story/state-by-state-look-at-hurricane-preparedness/07a83bbd088f492084a8b73ca196f435

Thursday, August 25, 2011

Hurricane Irene -VS- Hurricane Gloria. A Glimpse Into The Near Future Of Our Eastern Coastline. Are You Prepared?

Current Threat Level for Hurricane Irene
EXTREME


Northeast U.S. Threat Level


TWC's Exclusive Threat Level for Hurricane Irene


Find out the potential impacts from Hurricane Irene in the U.S. on The Weather Channel's exclusive threat level graphics below.


  • We've added an "EXTREME" threat level category from eastern North Carolina to southern New England. According to Hurricane Expert, Dr. Rick Knabb and Sr. Meteorologist, Stu Ostro, "this is a particularly threatening situation and it's best for people to be on alert."
  • Computer models are currently trending toward a forecast solution of rare potency for portions of the Northeast.
  • Irene has the potential to be a serious and multi-hazard threat for the major metropolitan areas of the Mid-Atlantic and Northeast. This includes Norfolk, D.C., Baltimore, Philadelphia, New York City, Hartford, and Boston. This hurricane has the potential to produce flooding rains, high winds, downed trees (on houses, cars, power lines) and widespread power outages. Significant impacts along the immediate coast include high waves, surge and beach erosion. The severity of the impacts will be determined by Irene's exact path and intensity, which remain uncertain at this time.
  • For North Carolina, odds are increasing that the main impacts of damaging winds and storm surge flooding will be confined to the far eastern portions of the state. In addition to the Outer Banks, this potentially includes Morehead City and Atlantic Beach.
  • Timing: Irene will make its closest approach to North Carolina late Friday night through Saturday. Northeast U.S. impacts would be this weekend into early Monday of next week.
  • We remain a couple of days away from Irene's direct impacts along the US East Coast and critical uncertainties related to Irene's exact track and intensity remain. Stay tuned to The Weather Channel and right here on weather.com for further updates.
Tropical Depression Eight


Thank you to http://www.weather.com/weather/hurricanecentral/article/tropical-depression-nine-storm-hurricane-irene_2011-08-20 for keeping us updated on this massive storm.


Now it is your time to prepare.  Are you following the preparedness orders from your local officials and from the media outlets in your area?  Don't take their emergency preparedness exclamation lightly.  This storm is being compared to Gloria, which ocurred in 1985.


Here's a little bit about what Hurricane Gloria did to the Atlantic coast.  This may be a glimpse of what the next few days may bring, so read carefully!...

Hurricane Gloria ...formed during the 1985 Atlantic hurricane season and prowled the Atlantic Ocean from September 16 to September 28. ...

Storm path

Overall, the storm caused extensive damage along the East Coast of the United States, amounting to $900 million ($1.84 billion in today's terms), and was responsible for eight fatalities.  


Gloria to the south of North Carolina

...the hurricane turned to the north-northeast, and its winds strengthened to 105 mph as it passed over the warm waters of the Gulf Stream.

Gloria then struck Cape Hatteras, North Carolina early on September 26, with winds of 105 mph ... while accelerating to the northeast.

Gloria became the strongest recorded hurricane to strike the U.S. East Coast so far north, a distinction it still holds. 


...Originally, the National Hurricane Center classified Gloria as a major hurricane upon making landfall ... the hurricane did produce Category Three wind gusts throughout Long Island.

Shortly thereafter the storm crossed the Connecticut coastline near Bridgeport as a Category 1 hurricane, and while continuing northeastward through New England, it became extratropical over Maine early on the 28th.

...Gloria brought strong wind gusts to the area, downing thousands of trees and leaving over two million people without power.

Overall, Gloria caused $900 million (1985 USD) in property damage and eight deaths, a total lower than expected due to the hurricane's arrival at low tide.


Carolinas and Mid-Atlantic

Upon making landfall on the Outer Banks, Gloria was a fast-moving hurricane that struck at low tide, reducing storm surges to a maximum of 6 ft in North Carolina.

 ... Diamond Shoal Light reported sustained winds of 100 mph, and Cape Hatteras, where the storm's eye came ashore, experienced 75 mph winds.

...Though Gloria moved quickly through the region, it dropped moderate rainfall in locations, including peaks of 7.09 inches in New Bern, North Carolina and 6.04 inches at Baltimore-Washington International Airport.

In addition, some unofficial reports in southeastern Virginia indicated amounts of up to 8 inches  of rain.

...High winds downed numerous trees throughout the area, leaving hundreds of thousands without power, including 237,000 in New Jersey, 124,000 in Maryland, and 56,000 in Virginia.

Extreme rainfall in Virginia resulted in $5.5 million (1985 USD, $9.8 million 2005 USD) in damage.

Intense flood waters split Long Beach Island in half for a period of time.

The hurricane's winds caused significant beach erosion, the area most affected being the Outer Banks.

Long Island and New York

Though Gloria hit Long Island with winds of 95 to 100 miles per hour, wind gusts reached 115 miles per hour in eastern Long Island.

Islip, New York recorded a wind gust of 85 miles per hour. However, few other wind reports were available from the island, as other weather instruments were damaged.

Weather forecasters believe that damage across parts of Long Island indicated winds in the Category Three range, as evidence of the damage received at MacArthur Airport.

Because the hurricane arrived at low tide, storm surges were generally low, peaking at 6.9 feet at Battery Park.

...Gloria's high winds caused significant damage across Long Island and southeastern New York.

The area hit the worst was eastern Long Island, where high wind gusts blew thousands of trees into buildings and across roads.

The broadcast tower of WBLI-FM toppled on Bald Hill in Farmingville.

In addition, the winds ripped roofs off of many buildings, including hangars at the MacArthur Airport and the roof of the Islip Police Station.

Prolonged exposure to high winds and waves led to moderate beach erosion, washing away several piers and docks.

The storm surge, though relatively weak, destroyed 48 houses on the ocean side of the island.

Gloria's high winds left 683,000 people in New York without power, with some lacking electricity for over eleven days.

Even though damage amounted to $300 million ($532 million in 2005 USD), due to well-executed evacuations there was only one casualty, the death occurring from a falling tree.

New England and Canada

Upon making landfall in Branford, Connecticut, Gloria was a weakened hurricane that passed quickly through the area.

Though still a large hurricane, Gloria hit at low tide, resulting in low to moderate storm surges of 5 feet in Groton, Connecticut, 6 feet  in New Bedford, Massachusetts, and 3 feet in Portland, Maine.

The hurricane produced gusty winds across New England, with a peak observation of 83 mph in Waterbury, Connecticut and Blue Hill Meteorological Observatory in Massachusetts.

Gloria dropped moderate precipitation in the area amounting to a maximum of 6 inches in Littleville Lake, Massachusetts. In addition, Gloria caused significant beach erosion in Connecticut and Rhode Island.

Rainfall totals from Gloria
Gloria's high winds downed numerous trees across New England, causing minor to moderate damage.

In the region, Connecticut received the worst of the hurricane, where tree and structural damage was greatest.

Along the coastline, storm surge and strong waves washed away several fishing piers, and some roadways were underwater during the storm's passage.

... In Maine, damage was more severe, where strong wind gusts ripped off roofs and uprooted hundreds of trees.

High winds across New England resulted in significant power outages, leaving 250,000 in Maine, 84,000 in Massachusetts, 174,000 in Rhode Island, and 669,000 in Connecticut without power.

In all, 7 deaths occurred in New England, many of which occurred from falling tree limbs.

The extratropical remnants caused minimal damage in Nova Scotia and produced tropical storm force winds across southern Newfoundland.

Aftermath

...Due to its impact, the name Gloria was retired from the Atlantic tropical storm name list in the spring of 1986, so it will never again be used for an Atlantic hurricane.


http://en.wikipedia.org/wiki/Hurricane_Gloria

Emergency preparedness is key in these disasters.  Follow what the officials tell you to do, i.e., evacuation, and remember your 72 hour kits.  If you are allowed to stay home and you are without power for an extended amount of time, you will find that you can live comfortably with plenty of water storage and rotating food storage, alternative lighting, generators, as well as a plan. 

Sending out prayers for all who are involved in this event!  May you find yourself safe, fed, clothed, and loved.

Tuesday, August 23, 2011

Why are there earthquakes in ..........?

UPDATE: 8-23-2011 12:34PM GMT
Now we are asking the question, "Why was there such a large earthquake in Virginia?"
This one was not very deep so there was more shaking felt and more damage than if it were a deeper quake.  This one has surely taken over the news of Libya!


First we were asking the question, "Why are there so many earthquakes happening in Arkansas?"

Next we were asking the question, "Why are there so many earthquakes happening in Oklahoma?"

Now we are asking the question, "Why are there so many earthquakes happening in Colorado?"


These earthquakes are not all small either.  A 5.3 is not small for this area of the United States!
Is this the building of underground tunnels that is rampant activity in the West?  Is is HAARP?  Is it an alignment with Comet Elenin, or another heavenly body?  Is it mining?  What is it?  If you have an answer to share, please feel free to comment.  I will be looking further into the possibilities here.

Tuesday, July 12, 2011

Earthquake Foreshocks In Four Areas Of The World. Preparedness Is Key.

Included below are this hour's pictures of what earthquakes have happened around the globe, in clusters, during the past seven days.


Remember that the new theory on Japan's quakes is that the quakes that occurred prior to the 9.0m were foreshocks.  There is the distinct possibility that the clusters of earthquakes that we are seeing in the regions shown below are foreshocks to something much higher in magnitude.


In the picture above, notice the recent cluster in the area of Indonesia.  Could this mean that in the next couple of weeks there could be some seismic activity that shakes Indonesia to its knees like that of 2004?  Let's hope not, but it it certainly something to watch based on new conclusions for the large Japan earthquake of 2011.


Again, remember that the new theory for the giant and horrific 9.0 magnitude earthquake for Japan is that the 7m quakes prior to the huge one were foreshocks.  Could this be happening again?  They experienced a 7.0 magnitude quake on June 10th.  Isn't that quite reminiscent of what happened prior to the 9.0?  Not only that, but they are experiencing quite a cluster in that area that flows all of the way down to the Indonesia area.


North America itself is not experiencing a huge amount of quakes this week.  However, there seems to be quite a cluster going on between North and South America.  This in addition to the Virgin Islands and Puerto Rico.  However, everyone needs to be vigilant in emergency preparedness for earthquakes because they seem to happen in spurts.  Therefore, North America needs to remain conscious and not let their guard down regarding this matter.


The 7.6 magnitude in the Kermadec Islands and New Zealand this week, along with the constant earthquake action there creates the logical conclusion that the movement will continue and perhaps there may be larger quakes there.  Pray for those people in New Zealand who have been experiencing these destructive forces more often than not as of late.

To summarize, we cannot accurately predict the earthquakes, but using the new theory from the Japanese quake, we can likely conclude that there is a large percentage of a chance that there will be a very large and very destructive quake in at least one of these four areas within the next couple of weeks if the uptick in quakes within these swarms continues. 


WARNING!: BAD THINGS HAPPEN - One Thing Can Prepare for Nearly Any Emergency - Find Out What Can Get You Ready


WARNING!: BAD THINGS HAPPEN - One Thing Can Prepare for Nearly Any Emergency - Find Out What Can Get You Ready


Thursday, June 23, 2011

Earthquake and Volcanic Activity Rising?

Steady Increase in earthquake and volcanic activity?  You decide.  Here is some documentation.  For each piece of documentation, I have labeled whether their is an INCREASE, DECREASE, or CONSISTENT in the answer to the question of whether there is an increase in earthquakes and/or volcanic activity.

.............................................................................................................................
INCREASE


...................................................................................................................................................
INCREASE
Latest Earthquakes in the World - Past 7 days
Worldwide earthquakes with M4.5+ located by USGS and Contributing Agencies.
(Earthquakes with M2.5+ within the United States and adjacent areas.)

World Recent Earthquake Map
Legend for earthquake map

Are Earthquakes Really on the Increase?

We continue to be asked by many people throughout the world if earthquakes are on the increase. Although it may seem that we are having more earthquakes, earthquakes of magnitude 7.0 or greater have remained fairly constant.
A partial explanation may lie in the fact that in the last twenty years, we have definitely had an increase in the number of earthquakes we have been able to locate each year. This is because of the tremendous increase in the number of seismograph stations in the world and the many improvements in global communications. In 1931, there were about 350 stations operating in the world; today, there are more than 8,000 stations and the data now comes in rapidly from these stations by electronic mail, internet and satellite. This increase in the number of stations and the more timely receipt of data has allowed us and other seismological centers to locate earthquakes more rapidly and to locate many small earthquakes which were undetected in earlier years. The NEIC now locates about 20,000 earthquakes each year or approximately 50 per day. Also, because of the improvements in communications and the increased interest in the environment and natural disasters, the public now learns about more earthquakes.
According to long-term records (since about 1900), we expect about 17 major earthquakes (7.0 - 7.9) and one great earthquake (8.0 or above) in any given year.
................................................................................................................................................
INCREASE
Below is a graph showing how the number of all magnitude earthquakes has grown over recent years. Although we are primarily concerned with long term trends for larger magnitude earthquakes in this report, it is worth noting the trend as it applies to all earthquakes - whether large or small, over a 30 years period or so from the mid-1970s. However, this trend needs to be understood in relation to the increase in seismographs. Certainly, in the last 25 years, more lower intensity earthquakes have been noticed because of a general increase in the number of seismograph stations across the world and improved global communications. This increase has helped seismological centres to locate many small earthquakes which were undetected in earlier decades. Therefore, an upward trend is not unexpected in the graph, although the rise in the number of large earthquakes will be of more significance to our assessment of the trend. By limiting the range of earthquakes being counted in this report to magnitude 7 or above, it means these earthquakes can easily be identified by a limited number of seismographs, and we have ensured that any increase in frequency for these larger earthquakes cannot be down to the increase in overall detection rates in this 25-year period, as all these larger earthquakes are able to be easily detected with fewer seismograph stations.


Graph above provided by DL Research. - http://www.dlindquist.com
The fluctuations in earthquake numbers for individual years show how unpredictable earthquakes are, and viewing on a year by year basis might make trend analysis harder to pinpoint.
.........................................................................................................................
CONSISTENT

VOLCANIC ACTIVITY GRAPHS


Finally, we plot below the record since reasonably comprehensive reporting of global volcanism began in the 1960s. Note that the number of confirmed erupting volcanoes has leveled off between 50 and 70 per year through the past four decades, and a linear regression line through the data indicates that volcanism has been virtually constant.


........................................................................................................................................


INCREASE

Earthquake Energy Rise on Earth 
Tom J. Chalko, MSc, PhD
Head of Geophysics Division, Scientific E Research P/L, Mt Best, Vic 3960, Australia


Conclusions 
The observed 5-fold increase in annual earthquake energy in the period 1980-2007 and the rapidly increasing trend are alarming.  


Results presented in this article indicate that the main danger for humanity on Earth may come not from a slow climate change, but from the rapidly increasing seismic/tectonic activity.  


In the period of time when the planetary climate changed by a small fraction of one degree, earthquakes have become 5 times more energetic. How long do we need to wait until someone brings this problem to our 
awareness? 


Awareness of the problem is essential not only to explain the reason for the observed phenomenon but also to consider possible solutions. 


What could be a reason for the observed 5-fold increase in annual earthquake energy?  


According to the currently adopted dogmas the planetary interior “crystallizes” in time and hence becomes more solid. Motion of tectonic plates should therefore become slower and the associated seismic activity should not increase in time.  
http://nujournal.net/EarthquakeEnergyRise.pdf
....................................................................................................................................................
INCREASE


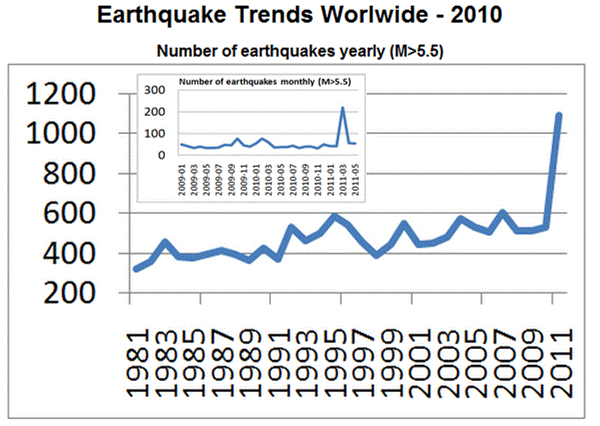
Worldwide earthquake data was acquired and shown graphically as a function of time. These trends show an increase in the magnitude and a significant increase in the frequency (magnitude > 5.5) of earthquakes worldwide


It is important to note the recent M9.0 earthquake in Japan and that earthquake frequency is extrapolated for 2011. The earthquake in Japan has probably lead to an overestimation of the yearly earthquake frequency for 2011. Nevertheless, these graphs clearly show an alarming worldwide trend of increasing earthquake strength and frequency. These results are in agreement with the USGS statistics page, which shows an increase in the frequency of stronger earthquakes (M > 5.0). As was mentioned in the main page, these events were prophesied in the Holy Scriptures. It is important to note the sharp increase in earthquake frequency during the month of March 2011.

These trends also show that the depth of earthquakes has diminished, they occur closer to the Earth's surface. Shallow earthquakes occur along fault lines and are due to the accumulation of stress. Earthquake waves can also propagate far enough to trigger other earthquakes; this may explain the noted increase in earthquakes.

Certain have stated that the increased frequency of earthquakes is due to the increased number of detection instruments installed worldwide. This would cause more sensitive earthquakes to be measured. However, these graphs show an increase in stronger earthquakes; it is also important to note that the earthquake Richter scale is base-10 logarithmic (Wikipedia). The fact that the world's population has increased doesn't help, more people are affected by these events. There is increased media avaiability and attention. However, due to recent events, it is now easy to convince even the average person, that there are more and more strong earthquakes occuring worldwide: 


Earthquake Frequency and Intensity

The M7.0 that struck Haiti in 2010 occurred in an active zone. However, the last earthquake to strike this region, with the same intensity, occurred in 1897 (Boston.com). The changing nature of earthquakes is catching many people off-guard. The recent earthquake in Japan (M9.0) was also of significance, as noted by USGS "The March 11, 2011 earthquake far surpassed other post-1900 plate-boundary thrust-fault earthquakes in the southern Japan Trench, none of which attained M8. A predecessor may have occurred on July 13, 869, when the Sendai area was swept by a large tsunami that Japanese scientists have identified from written records and a sand sheet." 

The strongest earthquakes that occcured in 2004 and 1981 will be compared. The M9.1 that occured in December 2004 had approximately 560*10E16J of energy; the M7.6 that occured in 1981 had only about 3.4*10E16J (see Wikipedia link for Ricther scale). The M9.1 released 165 times more energy than the M7.6. 


Impact of melting glaciers on earthquakes

A joint NASA-USGS (2004) study shows that melting glaciers may be increasing earthquake activity (NASA). As mentioned in the article, melting glaciers would change the load on the Earth's crust. As a glacier melts, the load would decrease at this relative point; melted water would flow into the ocean and increase the load over a different surface. It would be this change and/or even reversal of loading that would induce stress in the Earth's crust and increase earthquake activity. Based on these results, melting glaciers should be closely monitored National Snow and Ice Data Center. These results would seem to indicate that the water level need not change significantly to cause significant disruptions. These results would also indicate that the Earth's crust is not static and robust. Finally, areas that have low earthquke activity may become much more active due to melting glaciers.


....................................................................................................................................................................

INCREASE


US Govt Caught Hiding Earthquake Data to Discredit Climate Skeptic Expert?

By: John O’ Sullivan, APRIL 7,2011
New evidence shows US is not reporting worrying increase in earthquake activity predicted by independent skeptic expert.
Independent observers are monitoring an upsurge in seismic activity that began occurring across the United States during April 5 and 6 2011. It is feared that an earthquake similar in magnitude or greater than that which recently devastated Japan may hit the U.S. any time.
A live feed from the Advanced National Seismic System (ANSS) internet seismic server inexplicably went offline several times in a two-day period at a time when it appears increased seismic activity was occurring across the United States. The ANSS has offered no explanation for the anomaly.
The tremors are occurring at the precise time forecasted by Piers Corbyn, a leading British astrophysicist and weather forecaster. Corbyn believes heightened solar activity impacts not only our climate but also sets off earthquakes. Lately charged particles from solar flares have impacted our planet’s upper atmosphere at speeds of 560 miles per second.
Citizen Scientists Expose Government Cover Up
Reaction in the blogosphere has been instant. A YouTube video ‘New Madrid — multiple charts show movement — USGS censors data again’graphically illustrates how increased seismic activity is showing up via publicly accessible government data yet the U.S. authorities themselves are not reporting this latest worrying development.
The main agency responsible, United States Geological Survey (USGS) is another arm of corporate government like NASA, the EPA, the FDA which has been under sustained criticism for similarly manipulating global warming data.
Instruments show signs of significant seismic activity in a wide arc across Missouri, Tennessee, Virginia, Kentucky and Georgia. A 3.6 magnitude quake (minor) yesterday occurred in Greenbriar, Arkansas but conspicuously, the Helicorder for Portageville Missouri showed nothing on their maps. According to Richter scale seismic activity of 6 or above is considered ‘strong’ and is destructive in areas up to about 160 kilometres (100 mi) across in populated areas. A magnitude 3.6 quake caused Nevada’s PEPCON fuel plant explosion in 1988.
Latest Graphic Earthquake Images Shown on Youtube
In a 9-minute video commentator, ’dutchsinse suggests that such a broad spread of so-called “harmonic movement” across the continent as “concerning.” Coincidentally, the Pacific Northwest volcano webcorders also showed earthquake activity for this same period.
‘Dutch’ is also concerned that government-funded researchers may be intentionally censoring inconvenient seismic activity that would lend credence to Corbyn’s claims that lunar gravitational forces are instrumental not only on Earth’s climate but also on earthquake activity.
Corbyn has only recently launched his new earthquake forecasting service encouraged by the dramatic upsurge of interest in his highly successful long-range weather forecasting. It seems he may also be well set to provide an equally indispensable public service with his earthquake predictions.
On his WeatherAction.com website Corbyn announced:
“The 6-9th April is our first major (Trial) Earthquake risk period of April and comes with related extreme weather events forecasts. In these trial periods we expect an increase in the serious M6.0 and above quakes in quake vulnerable locations (and related increases in lower level activity) around the world such as the Pacific ‘ring of fire’. This includes the WEST USA which in this time period is probably more vulnerable than for decades.”
Coincidentally, the Kentucky Division of Emergency Management issued a press release (April 5, 2011) cancelling a media conference scheduled  for yesterday on earthquake preparedness.
Public Not Being Advised as to the Dangers
The greatest concern is for the Yellowstone National Park’s super volcano that also recently took a deep “breath” causing miles of ground to rise dramatically. Yellowstone’s caldera, which covers a 25- by 37-mile (40- by 60-kilometer) area of Wyoming, is an ancient crater formed after the last big blast, some 640,000 years ago.
Volcanologists say the simmering giant volcano is due another cataclysmic event. Such an eruption would be a thousand times more powerful than Mount St. Helen’s 1980 eruption.
Concerned citizens may wish to Twitter @USGS and demand to know why they are not reporting the data about these known earthquake events.
..........................................................................................................................................
INCREASE
5 Theories About the Increase in Seismic Activity
Mar 18th, 2011 | By Hayden | Category: Blog, Editorials & Conspiracies
Source: Activist Post
Planet Earth has experienced a very noticeable up-tick in earthquake activity and intensity over the last five years. Leading up to the great Japan quake...utter devastation from the 2004 Indian Ocean megathrust earthquake and tsunami, the catastrophic Haiti quake, an axis-moving Chile quake in 2010, massive and multiple quakes in New Zealand, and record earthquake swarms hitting Yellowstone and the New Madrid Fault line in middle America culminating with the worst earthquake in 35 years to hit the area...
The devastating effects on human civilization are on full display in the most recent 8.9 earthquake in Japan.  The powerful quake and corresponding tsunami showed that not even a fully developed nation with the world’s third largest economy can withstand nature’s fury.  This was also evident in the New Zealand quakes which continue to demolish the first-world city of Christchurch.
...
This new awareness of our fragile existence in the face of such powerful forces of nature has brought about many theories as to why earthquake activity is increasing.  Many will brush it off as natural occurrences without understanding that everything in nature is caused by something, whether or not it can be seen or measured.  Indeed, we are witnessing many earth changes happening for the first time in modern history.  And perhaps all of these anomalies are connected in some way, or at least compounding nature’s recent wrath.
Here are five theories as to the cause of increased earthquake activity:

SOLAR AND LUNAR ACTIVITY:

Meteorologist and astrophysicist Piers Corbyn claims a combination of solar activity and the extreme lunar cycle is the cause of the increased earthquakes.  He’s not alone.  On March 9th, NASA reported a powerful solar flare, an X1.5-class explosion from behemoth sunspot 1166 around 2323 UT, which they said would cause ‘global disturbances’.  On March 10th, Space.com posed the question “Will March 19 ‘Supermoon’ Trigger Natural Disasters?”  The very next day, the third largest earthquake ever recorded struck Japan.  Many scientist have speculated the “Supermoon”, set for peak arrival tomorrow, is causing gravitational disturbances because it is the closest the celestial body has been to the Earth in 18 years.

MAGNETIC POLE SHIFT:

As the magnetic pole continues to wander rapidly toward Russia, it has led to speculation that this might be leading to the record number of earthquakes seen in 2010, as well as the recent mega-quakes.  According to proponents of this theory, pole shift is a geomagnetic event that exerts pressure on the Earth’s tectonic plates. As the pole wanders, the core and plates realign producing fluctuations and great upheaval until the crust can stabilize.  The lights in the sky that have been recorded just prior to earthquakes may be evidence of the natural harmonic activity of the geomagnetic flux.  
 Simulation of the interaction between Earth's ... 
Geomagnetic Pole Shift/Wikimedia Image

HAARP:

Researchers into the potential for earthquake creation cite HAARP and its various counterpart arrays around the world as a principal theory for recent mega-quakes such as those in Haiti, Chile, and now Japan.  HAARP is a billion watt microwave that bounces frequencies off the ionosphere.  Admitted functions are forground penetrating radar, which some believe is a dangerous application that involves using frequencies that can disrupt the Earth’s natural magnetic field.  In fact, the Department of Defense gave a briefing on the subject while discussing weapons of mass destruction in 1997.  As observable evidence of such atmospheric tampering, researchers point to the correlations between visual anomalies such as colorful light displays and a characteristic wave pattern with a “punch hole” evident in cloud formations associated with these recent mega-quakes.
 

SHIFTING ICECAPS:

Some climatologists believe that shifting ice caps can have an effect on tectonic activity because the massive weight of the ice is changing locations. Global warming alarmists have sought to pin the great Japan quake on the disappearing ice, however they seem to lose credibility as polar ice is actually increasing according to U.S. Navy Polar Ice Prediction System. Yet, it seems feasible that even shifting ice, which appears to be moving in the direction of the North Pole shift, may indeed affect the flotation of the earth’s outer crust.  This could conceivably cause some tectonic movement and be partially related to some earthquake activity.
 arctic-sea-ice-thickness-2009-to-2011 
Shifting Polar Ice – U.S. Navy Polar Ice Prediction System

GAS FRACKING:

Since September of 2010, nearly 800 earthquakes rattled Arkansas and the New Madrid Fault Line. The entire state only experienced 38 quakes in 2009.  Hydraulic fracturing is the most likely cause of increased earthquakes.  Hydraulic fracturing (fracking) pumps water and chemicals into the ground at a pressurized rate exceeding what the bedrock can withstand, resulting in a microquake that produces rock fractures.  A close look at Arkansas’ history of earthquakes and drilling reveals a shockingly noticeable surge in quake frequency following advanced drilling. Although, fracking is now a global technique for finding natural gas, it’s unlike to be the cause of major earthquakes in Japan, New Zealand, Chile, or Haiti.
..............................................................................................................................................
I cannot find any reliable documentation that there is an earthquake decrease.  I can only find evidence of increase.  As far as the volcanic eruptions/volcanic activity, thus far it seems to be fairly consistent, according to some of the data that I have been able to retrieve.  However, increased earthquake activity will likely bring on an increase in volcanic activity as a probable eventuality because the two are definitely connected.  
In any case, are you prepared for emergencies?  Do you have your 72 Hour Kits prepared for each member of your family?  Do you have rotating food storage?  Do you have water storage?  If you answer no to any of these questions, you need to act now.  If any emergency happens, acting during the emergency will be inevitably a disaster in an of itself.   
Prepare Now!